Boston’s recent housing developments have some screaming “bubble!”, but the facts do not match the fears.

Creative Commons 3.0, Sfoskett: http://upload.wikimedia.org/wikipedia/commons/c/cc/Three_John_Hancock_Buildings.jpg
The economic downturn of 2008 introduced us to many terms – “quantitative easing” and “credit default swaps” are two of the most obtuse examples – but the most ubiquitous by far was “housing bubble,” and its central role in the downturn.
Beyond informing real estate professionals about the danger of speculation, the housing bubble also instilled a great fear of when the next bubble would take shape, and as a result, we’ve seen frequent reports stating that we are in the midst of another bubble.
Such is the climate for Smithfield & Wainwright’s new study, which has issued early “bubble” warnings for several areas – including right here in Boston.
A Market Out of Proportion
Smithfield & Wainwright’s study compares the price of sales/rents with that of “replacement costs,” meaning the underlying value of a property. In comparing and contrasting those measurements, the study aims to show what markets are outpacing their fundamentals.
According to the survey, the trends here in Massachusetts are not encouraging. At the bottom of the housing market’s post-bubble period, Smithfield & Wainwright found, home prices in Massachusetts were 17 percent above replacement costs; now, that percentage has jumped to 32, and that compares with a national gap of just 5 percent.
“It’s not back to where they were in 2006,” said Smithfield & Wainwright economist David Macpherson in a Boston Globe article, “but it’s starting to show the early signs of it.”
Simple Supply and Demand
As we indicated in our headline, we’re not jumping on the bubble-bandwagon just yet, and for a simple reason – supply and demand.
The great housing bubble was a creature of pure speculation – one where prices, spurred on by easy lending and risky Wall Street instruments, vaulted miles ahead of market fundamentals. Boston’s housing market today, meanwhile, is a create of those very fundamentals, and we have a couple of graphs that plainly demonstrate that fact.
First, here is a graph that shows how median sales price has trended in Greater Boston:
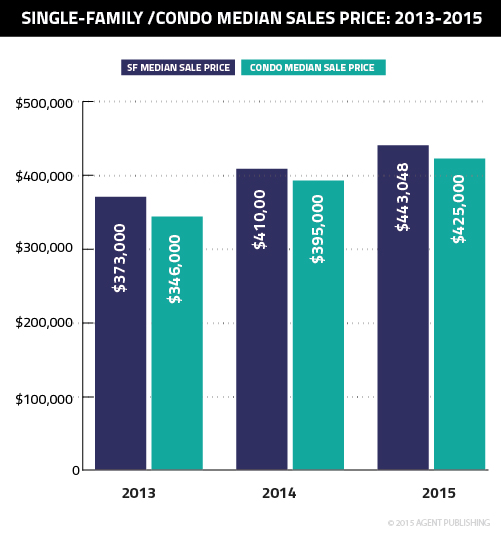
As you can see, median sales price has clearly increased since 2013, rising 18.8 percent for single-family homes and 22.8 percent for condos. Perhaps a bubble is in effect?
Yet, at the same time, consider this graph on housing inventory:
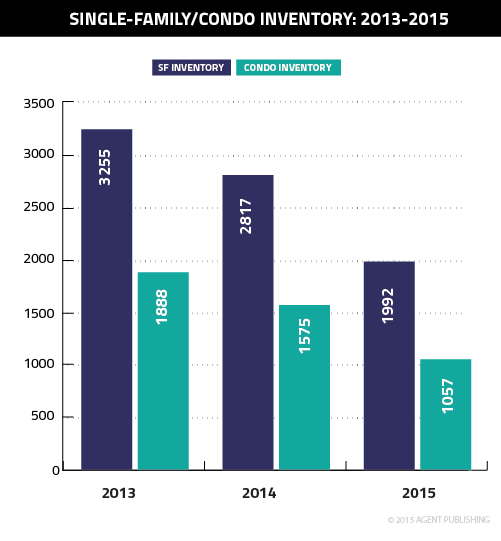
See what’s happened? As median price has continued to increase, housing inventory has continued to fall, with single-family inventory dropping 38.2 percent and condo inventory by 44.01 percent.
So what we really have is a case of rock-bottom supply, a seller’s market where low inventory has driven up price. Don’t get us wrong, that represents a big problem for Boston’s market (one we’ve reported on in detail), but it’s simply not accurate to label it a “bubble.”
I can’t speak to more specific fundamentals of the metro single family/condominium markets but I can weigh in with a few very important data points for Downtown Boston condominium sales ……..we have tracked WEEKLY from the B&T each Monday that —CASH PURCHASES FOR THE LAST 7 YEARS have averaged between 30-40% from a studio in the Fenway to a multi million dollar condominium ………there is a lot of liquidity in the marketplace to go along with ONE MONTH’S SUPPLY DOWNTOWN + with the new development pipeline of 22 Liberty in 2015 and Millenium Tower in 2016 for respective CO construction completion dates adding no NEW NET ADDITION TO MONTHLY INVENTORY SUPPLY!! ..