Trends
For data-driven stories, to appear under “Trends” menu
Home sales in the 51 metro areas surveyed by REMAX rose 7.9% month over month and slid 0.5% year over year.

Consumers increasingly accept electric vehicles, but not every state offers the infrastructure needed to make the lifestyle switch.
The increase was driven by refinancing activity as purchase applications dipped.

With demand driving prices skyward, researchers decided to compare FIFA World Cup ticket costs to another expensive commodity — housing.

The 3.8% month-over-month gain was almost four times what industry observers were expecting.

Paint color has the power to enhance value — or tank it.

Inventory rose 3.3% month over month and 0.6% year over year to 1.55 million homes, which equals a 4.5-month supply of unsold inventory, NAR said.
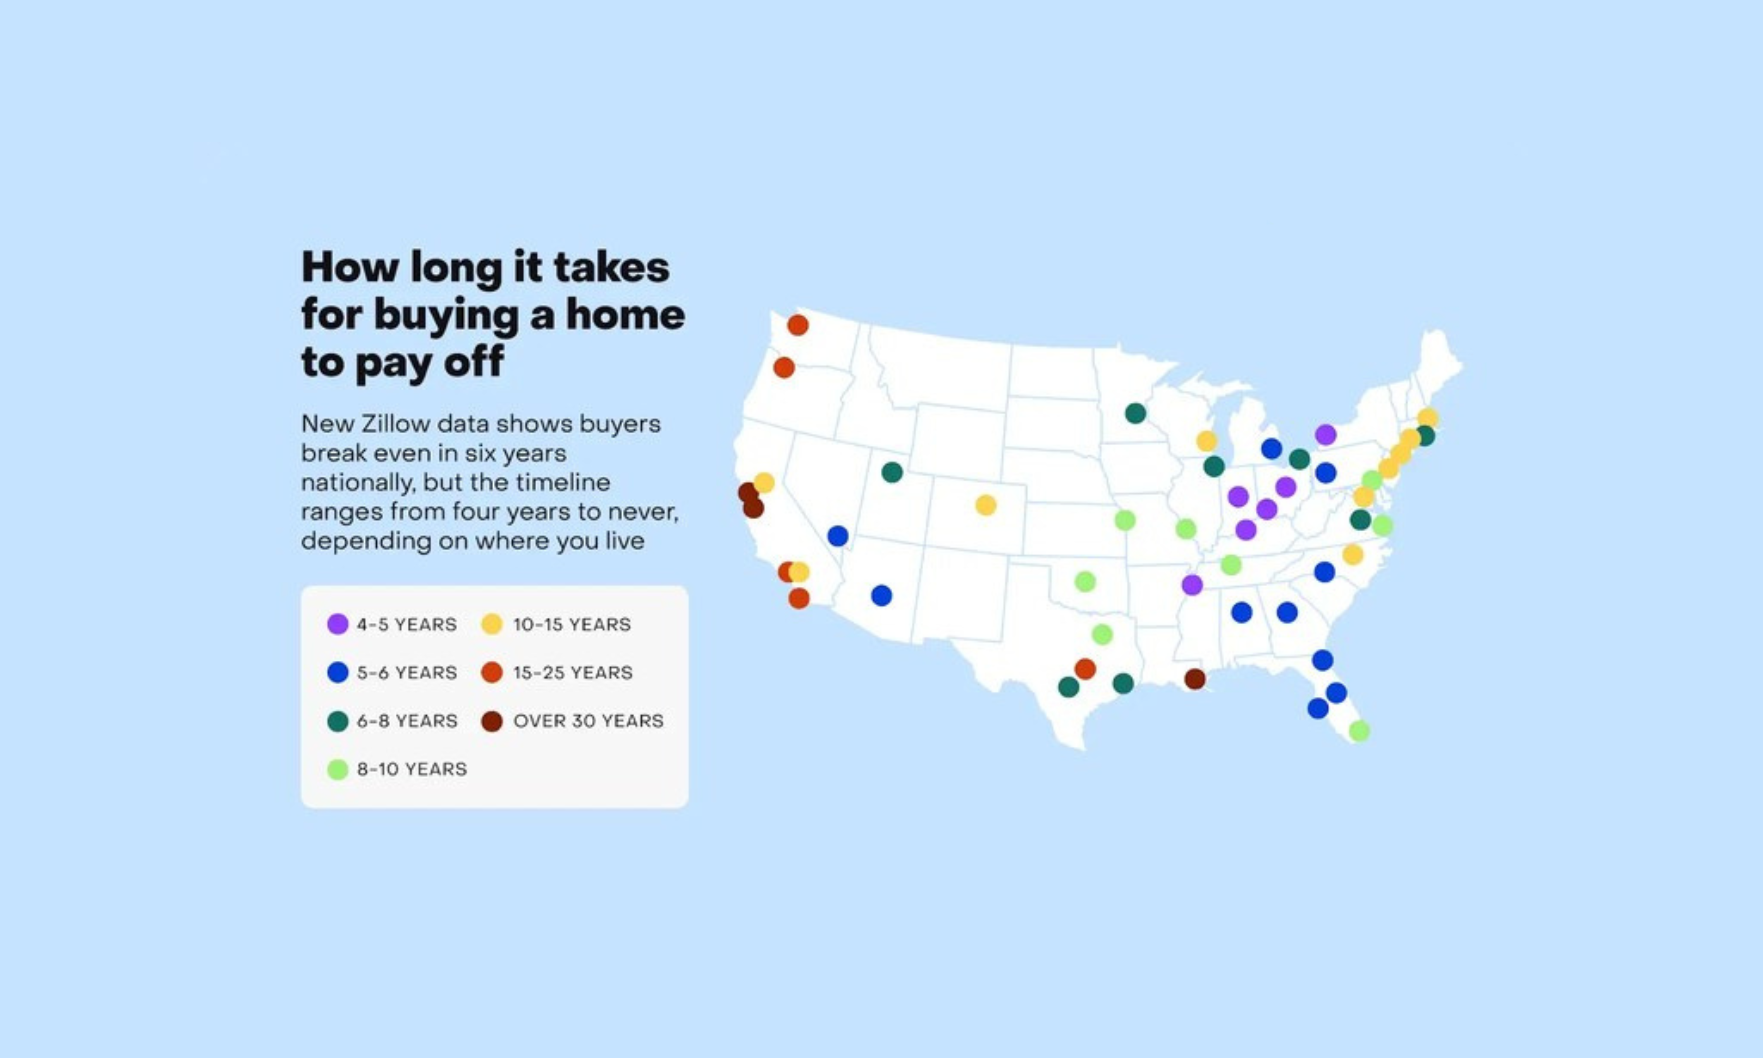
Nationwide, it takes six years to break even on homeownership, down from an all-time high of 8.4 years in 2023.

Notably, the Commonwealth had the highest percentage of firms listed on the Technology Fast 500 list.
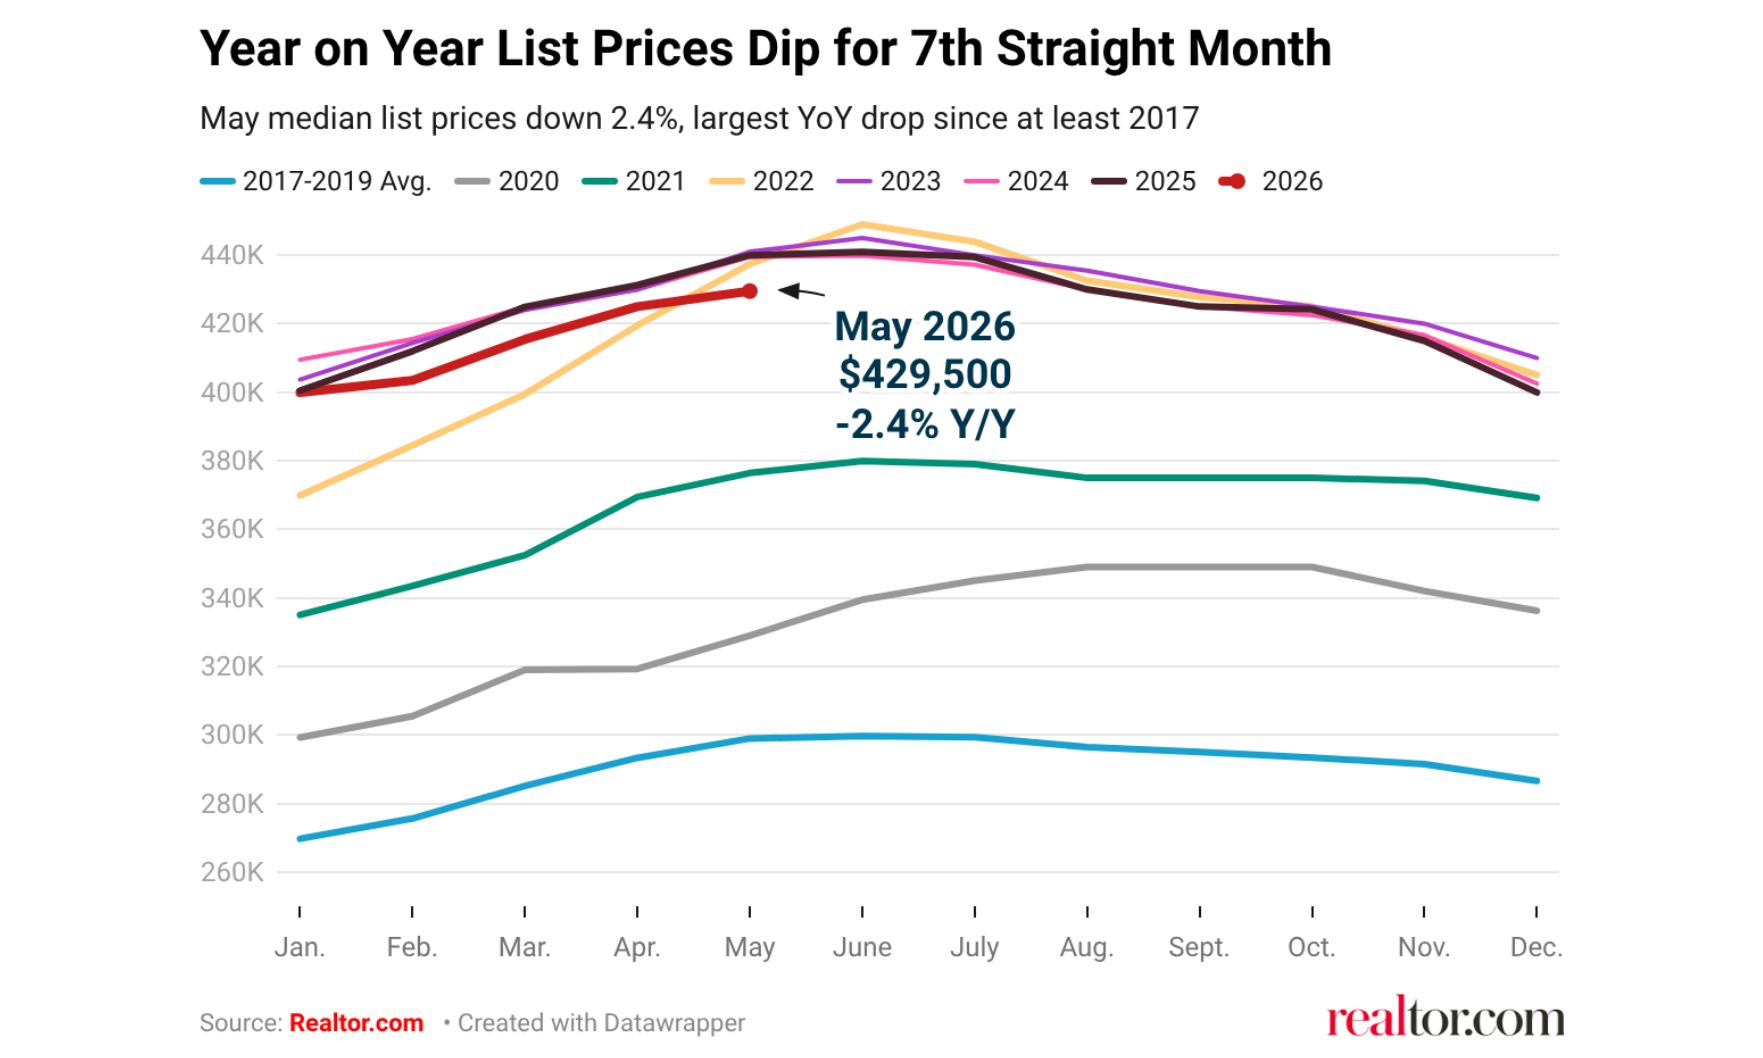
Amid what Realtor.com called the most active spring in years, the housing market is finding a new equilibrium.

Older homes often come with hidden costs, like leaky roofs, worn-out water heaters and drafty windows.
Looking ahead, Cotality expects home prices to rise 5.3% between April 2026 and April 2027.

The median sales price of new homes sold in April rose 8% to $422,500 from $391,100 in March, the U.S. Census Bureau and the Department of Housing and Urban Development reported.

Home prices continued to rise in March, but the rate of increase slowed yet again, according to the latest S&P Cotality Case-Shiller Home Price Index.
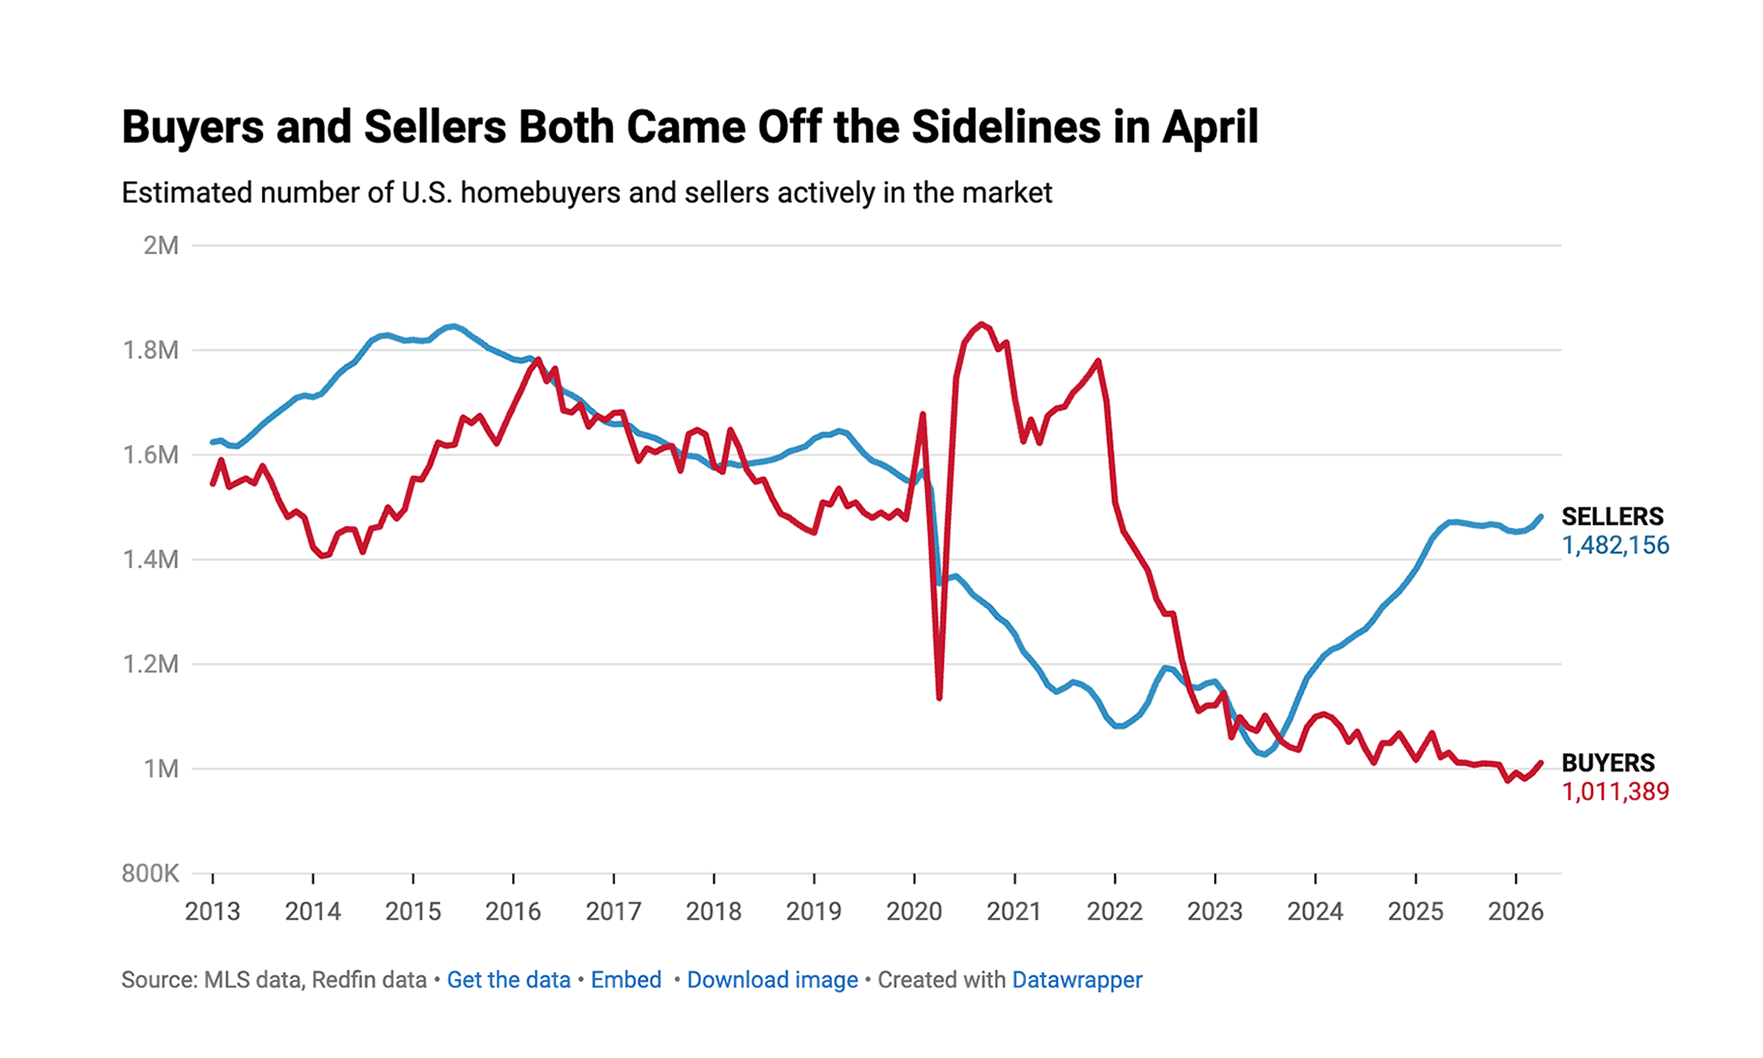
Redfin reports there were about 46.5% more sellers than buyers in April 2026, down from 47.5% in March and 48.9% in December 2025.

Houzz compared first quarter user activity to year-ago levels to determine the emerging home trends for summer 2026. Here’s what they found.