Current Market Data

After a sluggish first half of the year, new listings for single-family homes increased year-over-year by 10.7% and rose by 13.9% for condos.

The median sales price of a home hit an all-time high of $440,600.
Looking ahead, Cotality expects home prices to rise 4.8% between May 2026 and May 2027.
Housing starts shot up in Boston as new construction projects commenced. Meanwhile, homes and condos spent a few more days on the market before selling compared to a year ago.
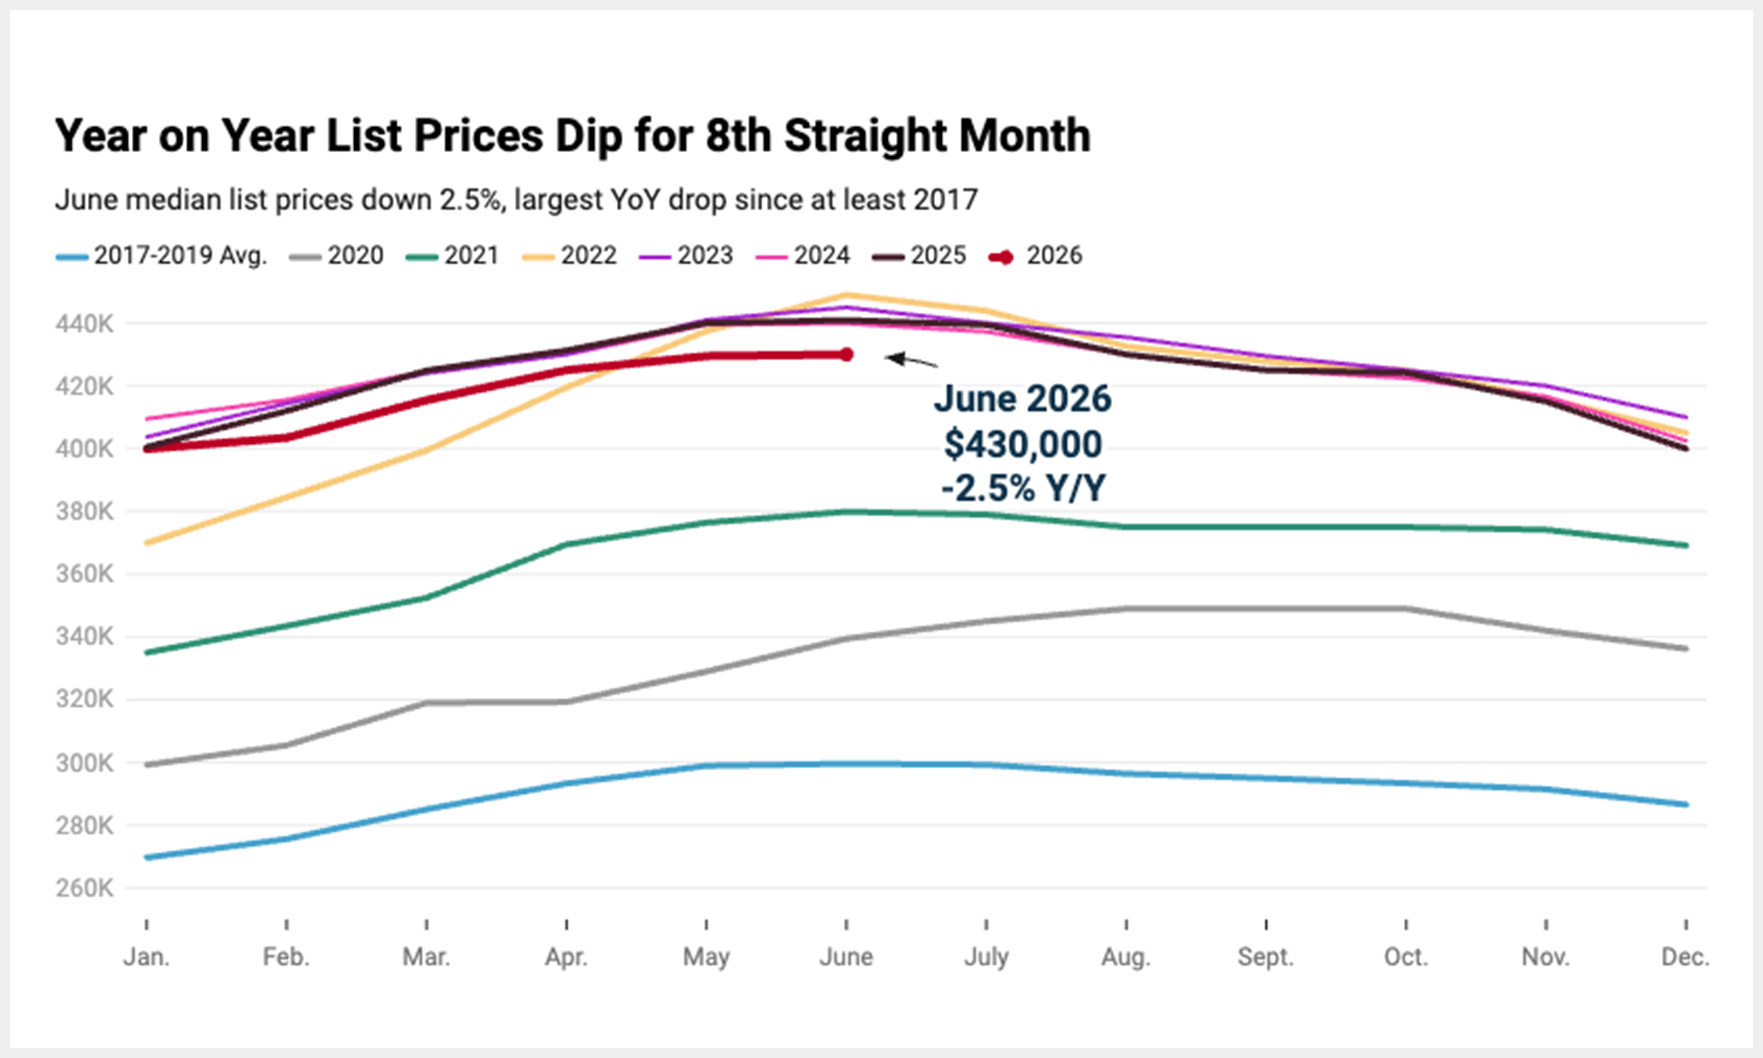
Nationally, the median list price slipped 2.4%, marking the eighth month in a row of declines.
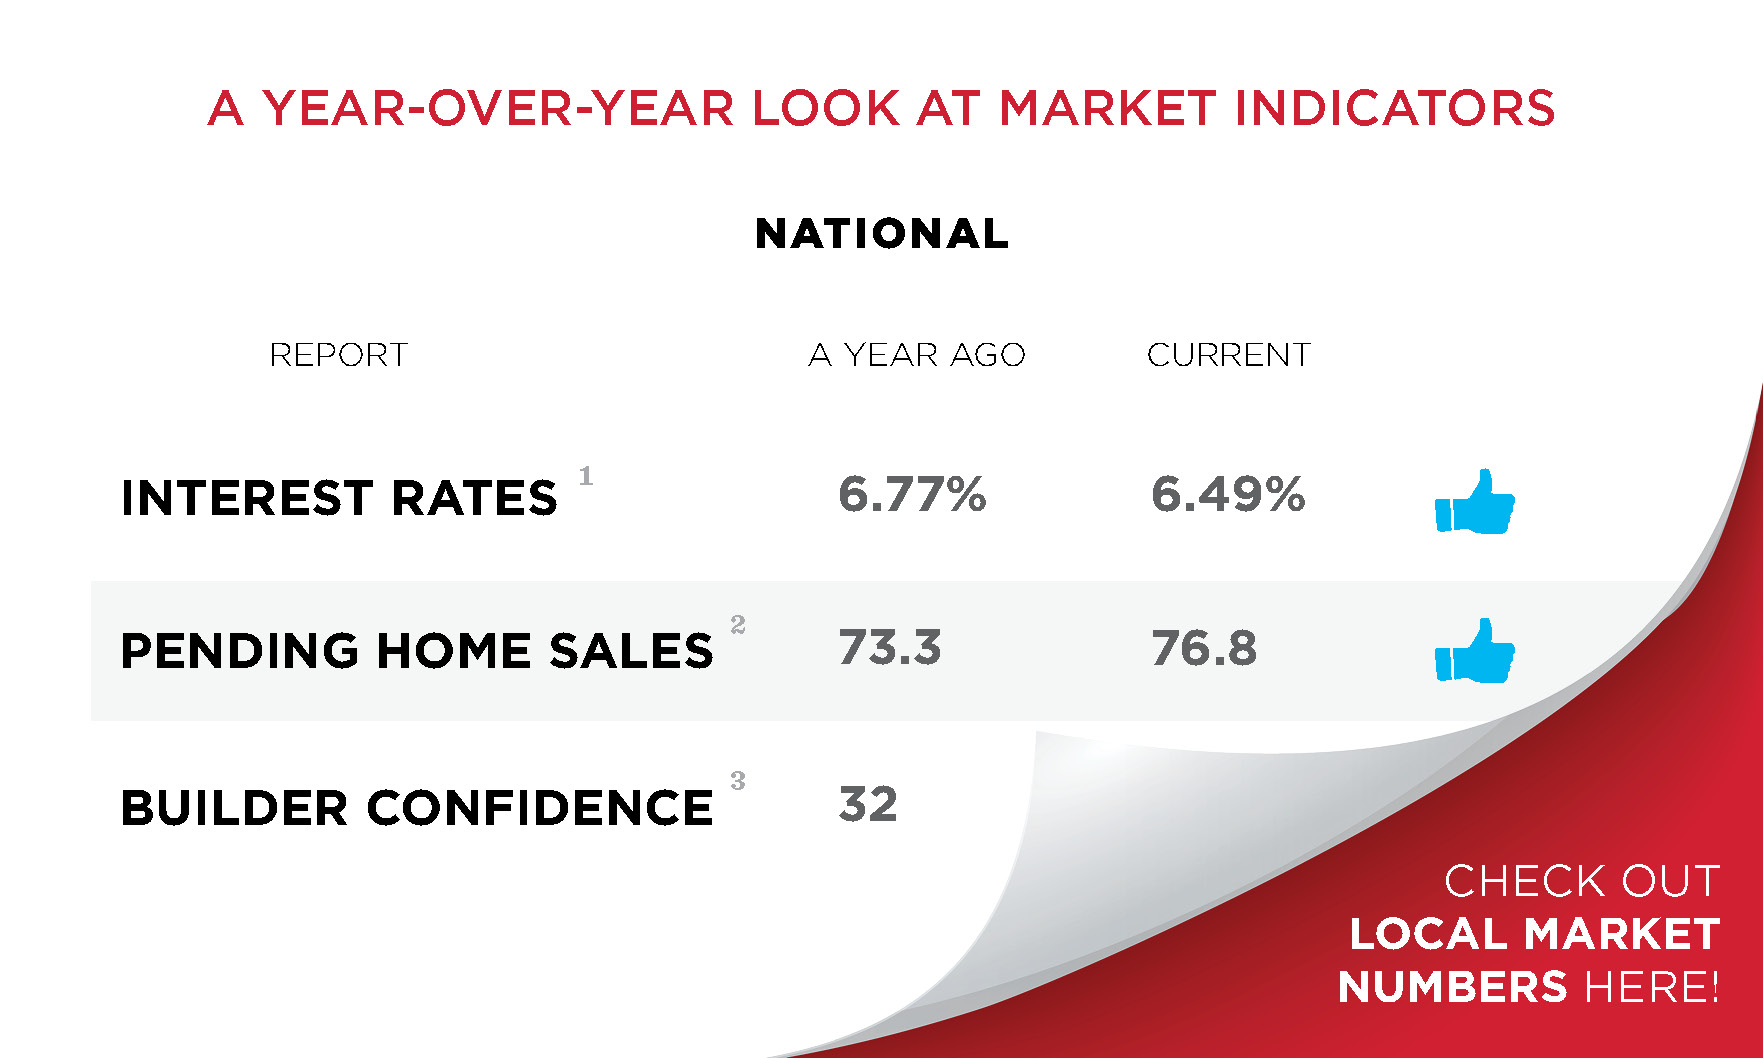
The uptick was driven by a slight dip in mortgage rates.
S&P Dow Jones Indices noted that inflation outpaced national home-price appreciation for the 11th month in a row.
Home sales in the 51 metro areas surveyed by REMAX rose 7.9% month over month and slid 0.5% year over year.

Consumers increasingly accept electric vehicles, but not every state offers the infrastructure needed to make the lifestyle switch.
The increase was driven by refinancing activity as purchase applications dipped.
Existing-home sales and the median home price are forecast to rise 4% this year, according to the National Association of REALTORS® Chief Economist Lawrence Yun.

With demand driving prices skyward, researchers decided to compare FIFA World Cup ticket costs to another expensive commodity — housing.

Starter homes now cost $1 million or more in a record 242 cities, up from just 80 in 2020, according to a Zillow analysis.

The 3.8% month-over-month gain was almost four times what industry observers were expecting.

Paint color has the power to enhance value — or tank it.

Meanwhile, new listings grew by 3.5% year –over year for single-family homes and 8.9% for condos.