
By the Numbers

Purchase applications slowed to their lowest level since May as economic worries dampened activity, the Mortgage Bankers Association said.

Wellesley, Winchester, Lexington and Needham ranked among the nation’s top suburbs based on median household income, home values and other economic indicators.
May’s 1.8% monthly gain follows a 6.3% drop in April, the National Association of REALTORS® said.

“The biggest trend we’re seeing in the market over the last few months is the increase in inventory,” noted CCIAOR President Todd Machnik.

The pace of home-price appreciation slowed to its most modest pace since 2023, according to the S&P CoreLogic Case-Shiller U.S. National Home Price Index.

The median-sales price for an existing home rose 1.3% year over year to $422,800.
Nationally, home sales slid 3.5% year over year but rose 8.6% month over month, RE/MAX said.

Homebuilder sentiment recently reached its third-lowest level since 2012.

Housing inventory boomed during the month of May even as high prices continued to break records, according to a report released by the Greater Boston Association of REALTORS.

“With the continued increase in new listings, it’s a positive sign for buyers struggling to
find their stride in the market,” said Sarah Gustafson.

The Mortgage Bankers Association said the post-Memorial Day increase came despite economic uncertainty and largely static interest rates.
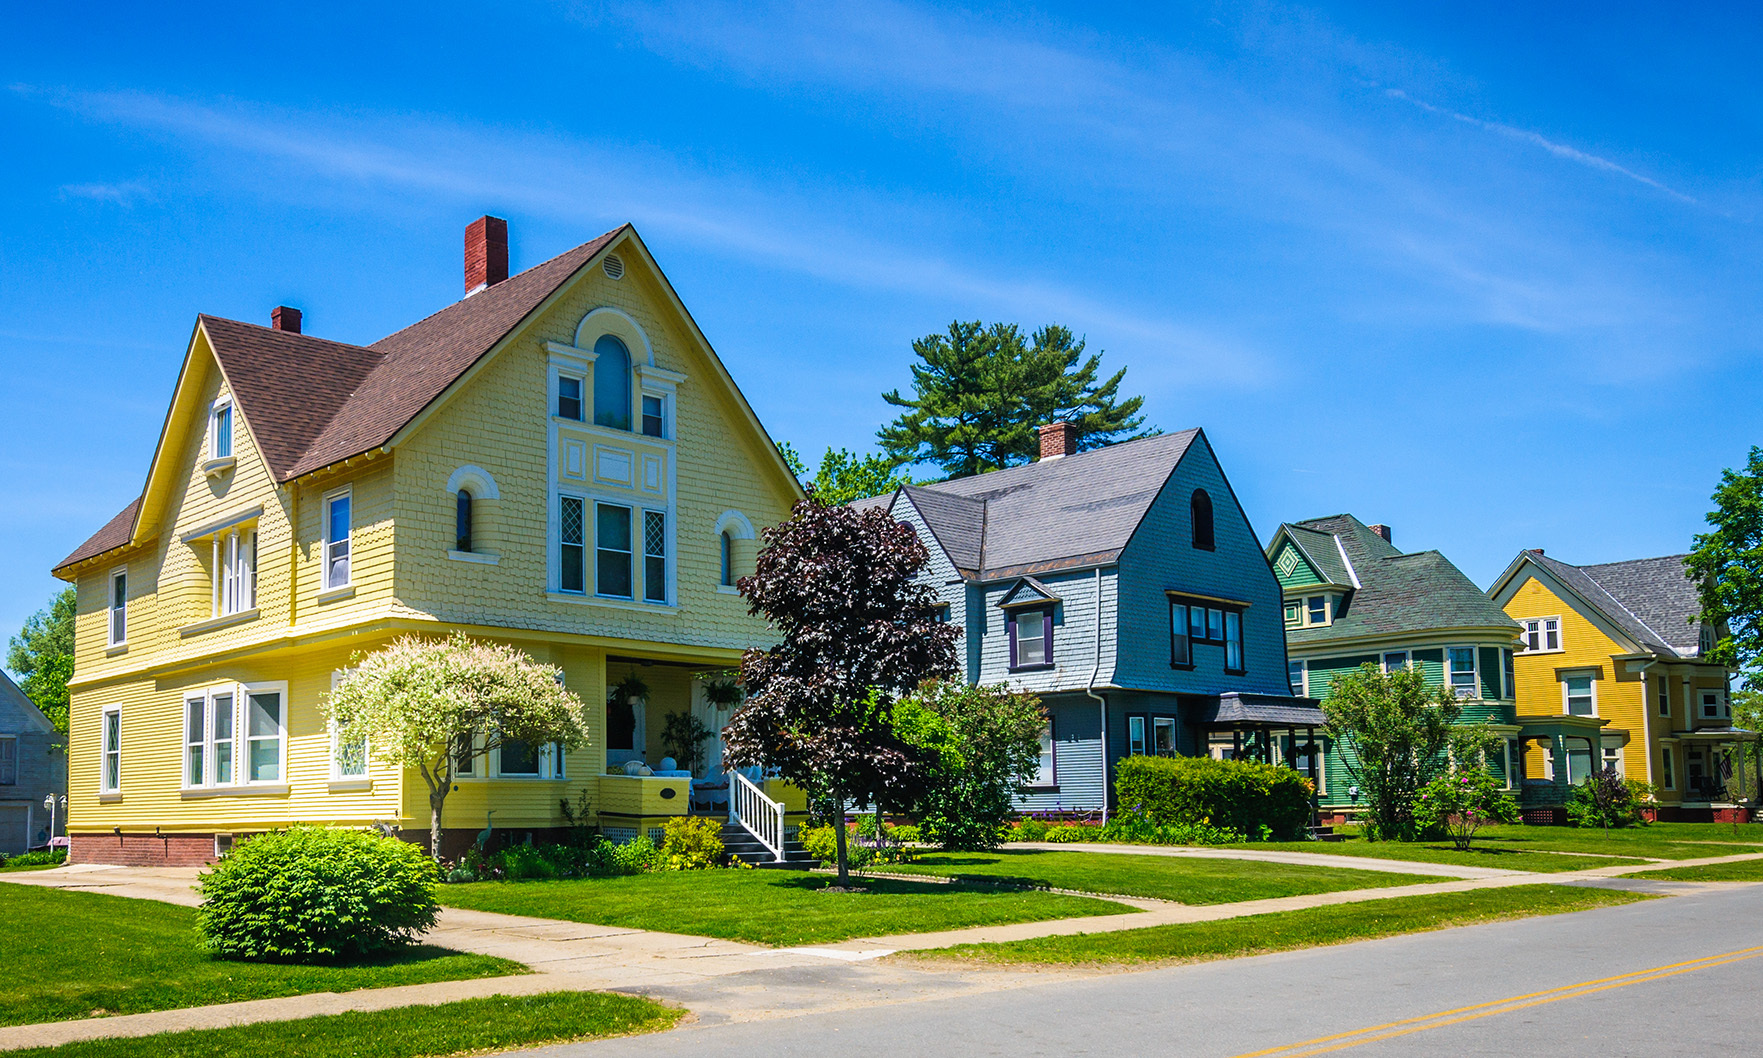
Plus, with a median build year of 1964, Massachusetts has the third-oldest median home age in the nation.

The Northeast and Midwest remained strong, while Florida, which saw a major runup in prices in recent years, continued to cool.
The 6.3% month-over-month decline was the steepest the U.S. market has seen since September 2022.
In Boston, home prices rose 4.72% year over year and 0.74% month over month in March.
Nationally, home sales slid 1.4% year over year but increased 11.3% month over month, RE/MAX said.