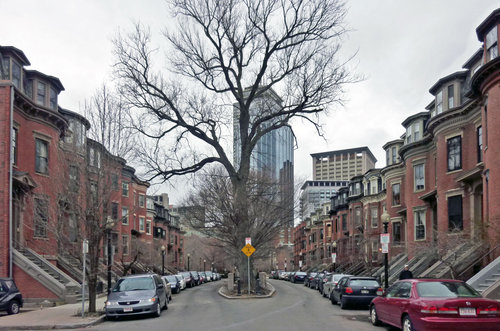
Home prices in Boston have risen steadily, albeit in line with the national averages
Home prices in the Boston metro area rose 0.4 percent monthly and 4.6 percent year-over-year in August, according to the new Case-Shiller Home Price Indices from Standard & Poor’s.
Both statistics are consistent with not only the nation’s averages, but with complementary statistics from the Greater Boston Association of Realtors.
August Case-Shiller – Prices Remain Positive
Nationwide, the Case-Shiller was consistent with past months:
- The S&P/Case-Shiller U.S. National Home Price Index, which covers all nine U.S. census divisions, rose 4.7 percent year-over-year in August, compared with a 4.6 percent rise in July.
- The 10-City and 20-City Composites, which focus on the nation’s largest metro areas, rose 4.7 and 5.1 percent, respectively; both increases were 2 bps higher than July’s gains.
- On a monthly basis, home price growth was far less positive, with the National Index rising just 0.3 percent from July to August; the 10- and 20-City Composites rose 0.3 and 0.4 percent, respectively, though with seasonal adjustments, those increases fell to 0.1 percent.
- There are clear signs of housing slowdowns across the country – for instance, San Francisco had the highest year-over-year price increase in the nation with 10.7 percent, yet its -0.1 percent decline from July to August was the only negative drop in the country.
Blitzer – Low Inflation Benefits Housing
David M. Blitzer, the managing director and chairman of the Index Committee for S&P Dow Jones Indices, explained why the current home price growth is a positive for homeowners.
“A notable part of today’s economy is the continuing low inflation rate; in the year to September, consumer prices were unchanged,” Blitzer said. “Even excluding food and energy, the core inflation was 1.9 percent. One result is that a 5 percent price increase in the value of a house means more today than it did in 2005-2006 – the peak of the housing boom – when the inflation rate was higher. The rebound from the recent lows was faster than the 1997-2005 housing boom, and also much less driven by inflation.”
Photo Credit: Creative Commons 2.0: Payton Chung, http://commons.wikimedia.org/wiki/File:2011_SouthEnd_Boston_5576671995.jpg

