The post-boom construction narrative soldiers on with the release of the latest building data from the Census Bureau.
On the surface, it looks pretty bad – according to fresh numbers out today from the U.S. Census Bureau and Department of Housing and Urban Development, housing starts in August were at a seasonally adjusted annual rate of 956,000, a 14.4 percent decline from July’s 1.117 million.
Of course, this being new construction in the post-boom era, there are many nuances to the Census Bureau’s report, and we’ve highlighted five of the most important below:
1. This is Just One Month – Yes, housing starts were down quite a bit from July to August, but the longer trend is more encouraging. Year to date, total starts are up 9 percent, with single-family and multifamily starts up 3 percent and 23 percent, respectively; also, from June to August, home construction was still ahead of 2013’s summer months, with total starts up 14 percent, single family up 4 percent and multifamily up a whopping 38 percent.
2. Multifamily is to Blame – As you surely noticed, those multifamily numbers are quite impressive, but it was also multifamily’s volatile month-to-month decline in starts that led to August’s disappointing numbers. From July to August, multifamily starts fell from 423,000 to 304,000, a 28 percent decline; given the huge role multifamily has played in the construction recovery, such a decline will inevitably sway the overall market’s numbers.
3. Multifamily Inventory is Soaring – One number that did not disappoint in the Census Bureau’s report was completions, which rose 3.2 percent from July and 16.9 percent from August 2014 (meaning, many more new residences were completed and entered the marketplace). Once again, though, it was multifamily driving that increase; single-family completions were down 8.2 percent from July to August, but multifamily completions were up 46.7 percent to 292,000.
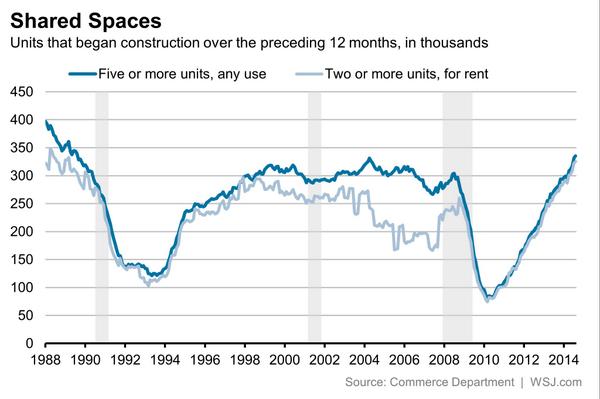
4. Multifamily is Historic – Even with August’s dip, multifamily construction is still running at an enormously high level. In fact, as this Wall Street Journal graph demonstrates, multifamily construction is at its highest level since 1989:
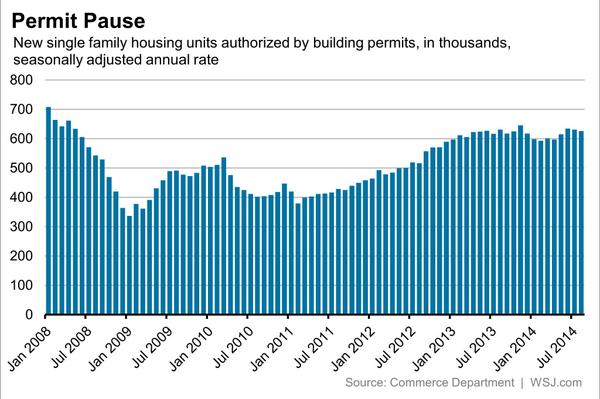
5. Single-Family Continues to Lag – Single-family building permits, meanwhile, were down 0.8 percent from July to August, and for all of 2014, single-family permits have been remarkably static, as another graph from the Journal demonstrates:
The craziest part? Even with those lagging numbers, there’s a very good chance that single-family home construction is still too high for the current housing market; stay tuned for our next story on construction to find out why.