Current Market Data

While the housing market may be hotter than usual, the shift toward seasonal norms is starting to show and could benefit both buyers and renters.

The demand for housing in the U.S. has reached a new all-time high since 2017, a rare occurrence for this time of year when the market typically slows. According to a Redfin report, a recovering economy and all-time low mortgage rates are critical factors in the current market.
The seasonally adjusted estimate of new houses for sale at the end of September was 389,000, representing a supply of 6.3 months at the current sales rate, the U.S. Census Bureau and the U.S. Department of Housing and Urban Development reported.

As the economy recovers from COVID and the housing market gains traction, homeownership is top of mind for Americans, according to the latest survey from Coldwell Banker Real Estate LLC.

As dramatic rent prices impact states across the nation, renters are searching for more affordable places to call home. Nationally, the median rent price is up over 16% since January, with some cities seeing double that, according to a recent Apartment List report.

Demand for second homes was up 70% from pre-pandemic levels in October, according to a new report from Redfin. This outpaced August’s 48% gain but was below January’s record 91% growth.
The U.S. housing market kept firing on all cylinders, as the demand for residential real estate drove prices higher for the 116th month in a row, marking the longest streak on record.

It’s been a crazy year for real estate with bidding wars, record home prices and historically low inventory, but that may all come to an end in 2022.

Single-family home and condo sales in the Bay State dropped significantly in October, as median prices continued to climb.
November’s reading of 83 was up three points from October, driven by low existing inventories and strong buyer demand, the National Association of Home Builders reported, citing the latest NAHB/Wells Fargo Housing Market Index.
Housing observers noted that demand for housing remains robust despite the lack of new supply.

Should you wait until spring to put your home on the market? A recent Realtor.com report says, not necessarily.

Boston led the Northeast with its percentage of mortgaged properties categorized as equity rich in the third quarter. The Bay State also had two counties with the highest share of equity-rich properties.
According to real estate data provider ATTOM, foreclosure filings, which include default notices, scheduled auctions or bank repossessions, rose 5% in October on a monthly basis and 76% from October 2020, to 20,587 filings.
Seventy-eight percent of the 183 U.S. markets monitored by the National Association of Realtors had double-digit increases in their median home prices, a decline from the second quarter, when 94% of markets saw double-digit increases.
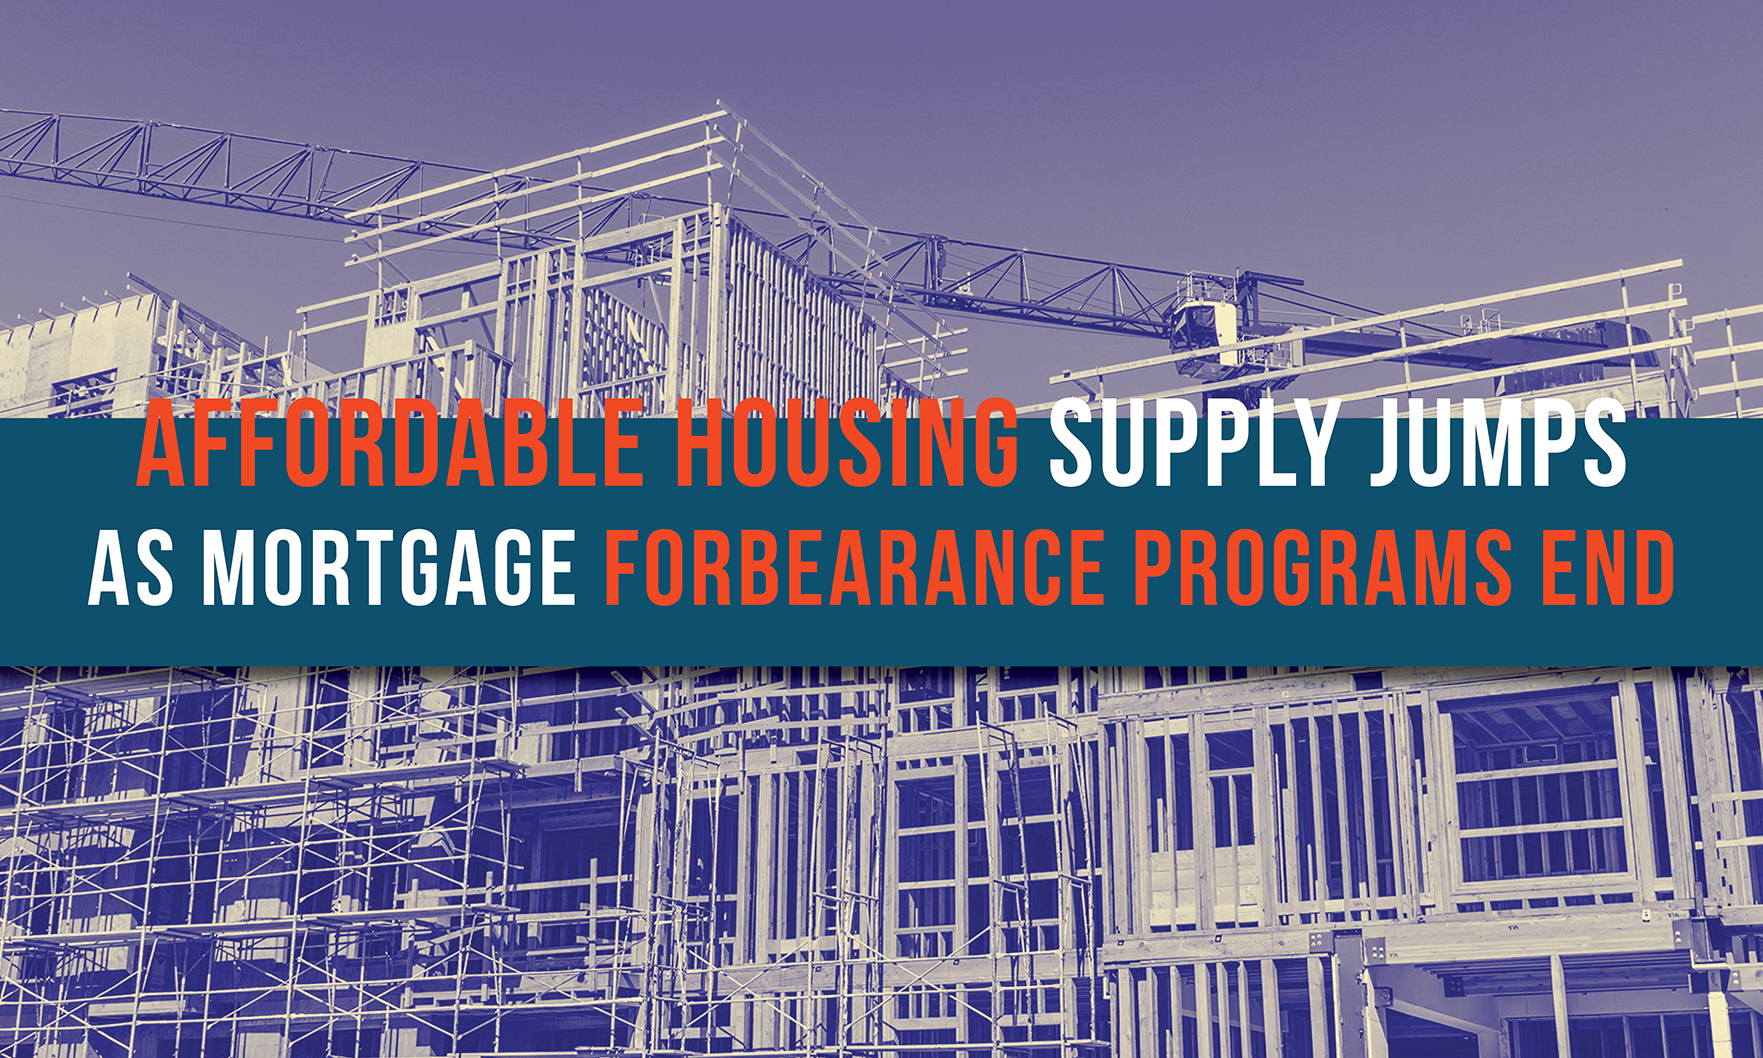
The supply of affordable homes on the market rose a record 13% in the third quarter as mortgage forbearance programs ended, prompting low-cost homeowners to put their properties on the market.