
Meeting Boston’s ambitious goals for new housing development in the next several years presents significant challenges for the city. Part of that difficult task involves understanding exactly what future Boston residents will need in terms of available housing stock. Rather than gaze into a crystal ball, the Boston Planning and Development Agency analyzed the area’s demographic trends between 2010 and 2017, the latest year for which the most accurate data is available. What they found: a more diverse, more educated — yet less mobile — city.
This may not come as a surprise to most residents, but the BPDA found the city had experienced rapid population growth since 2010, showing a nearly 10 percent increase through 2017. That’s almost double the national population growth rate for the same period, according to Census data. Boston also became slightly older on average, with the city’s median age growing from 30.8 years old to 32.3.
With strong population growth by numbers, Boston has grown more diverse, too. The city’s Latino and Asian population grew to comprise 20.4 percent and 9.7 percent of the total, respectively. The share of foreign-born residents also rose from 26.9 percent to 29.3 percent. Increasing numbers of Bostonians ages 5 and up speak English in addition to another language at home, with 17 percent identifying as Spanish speakers.
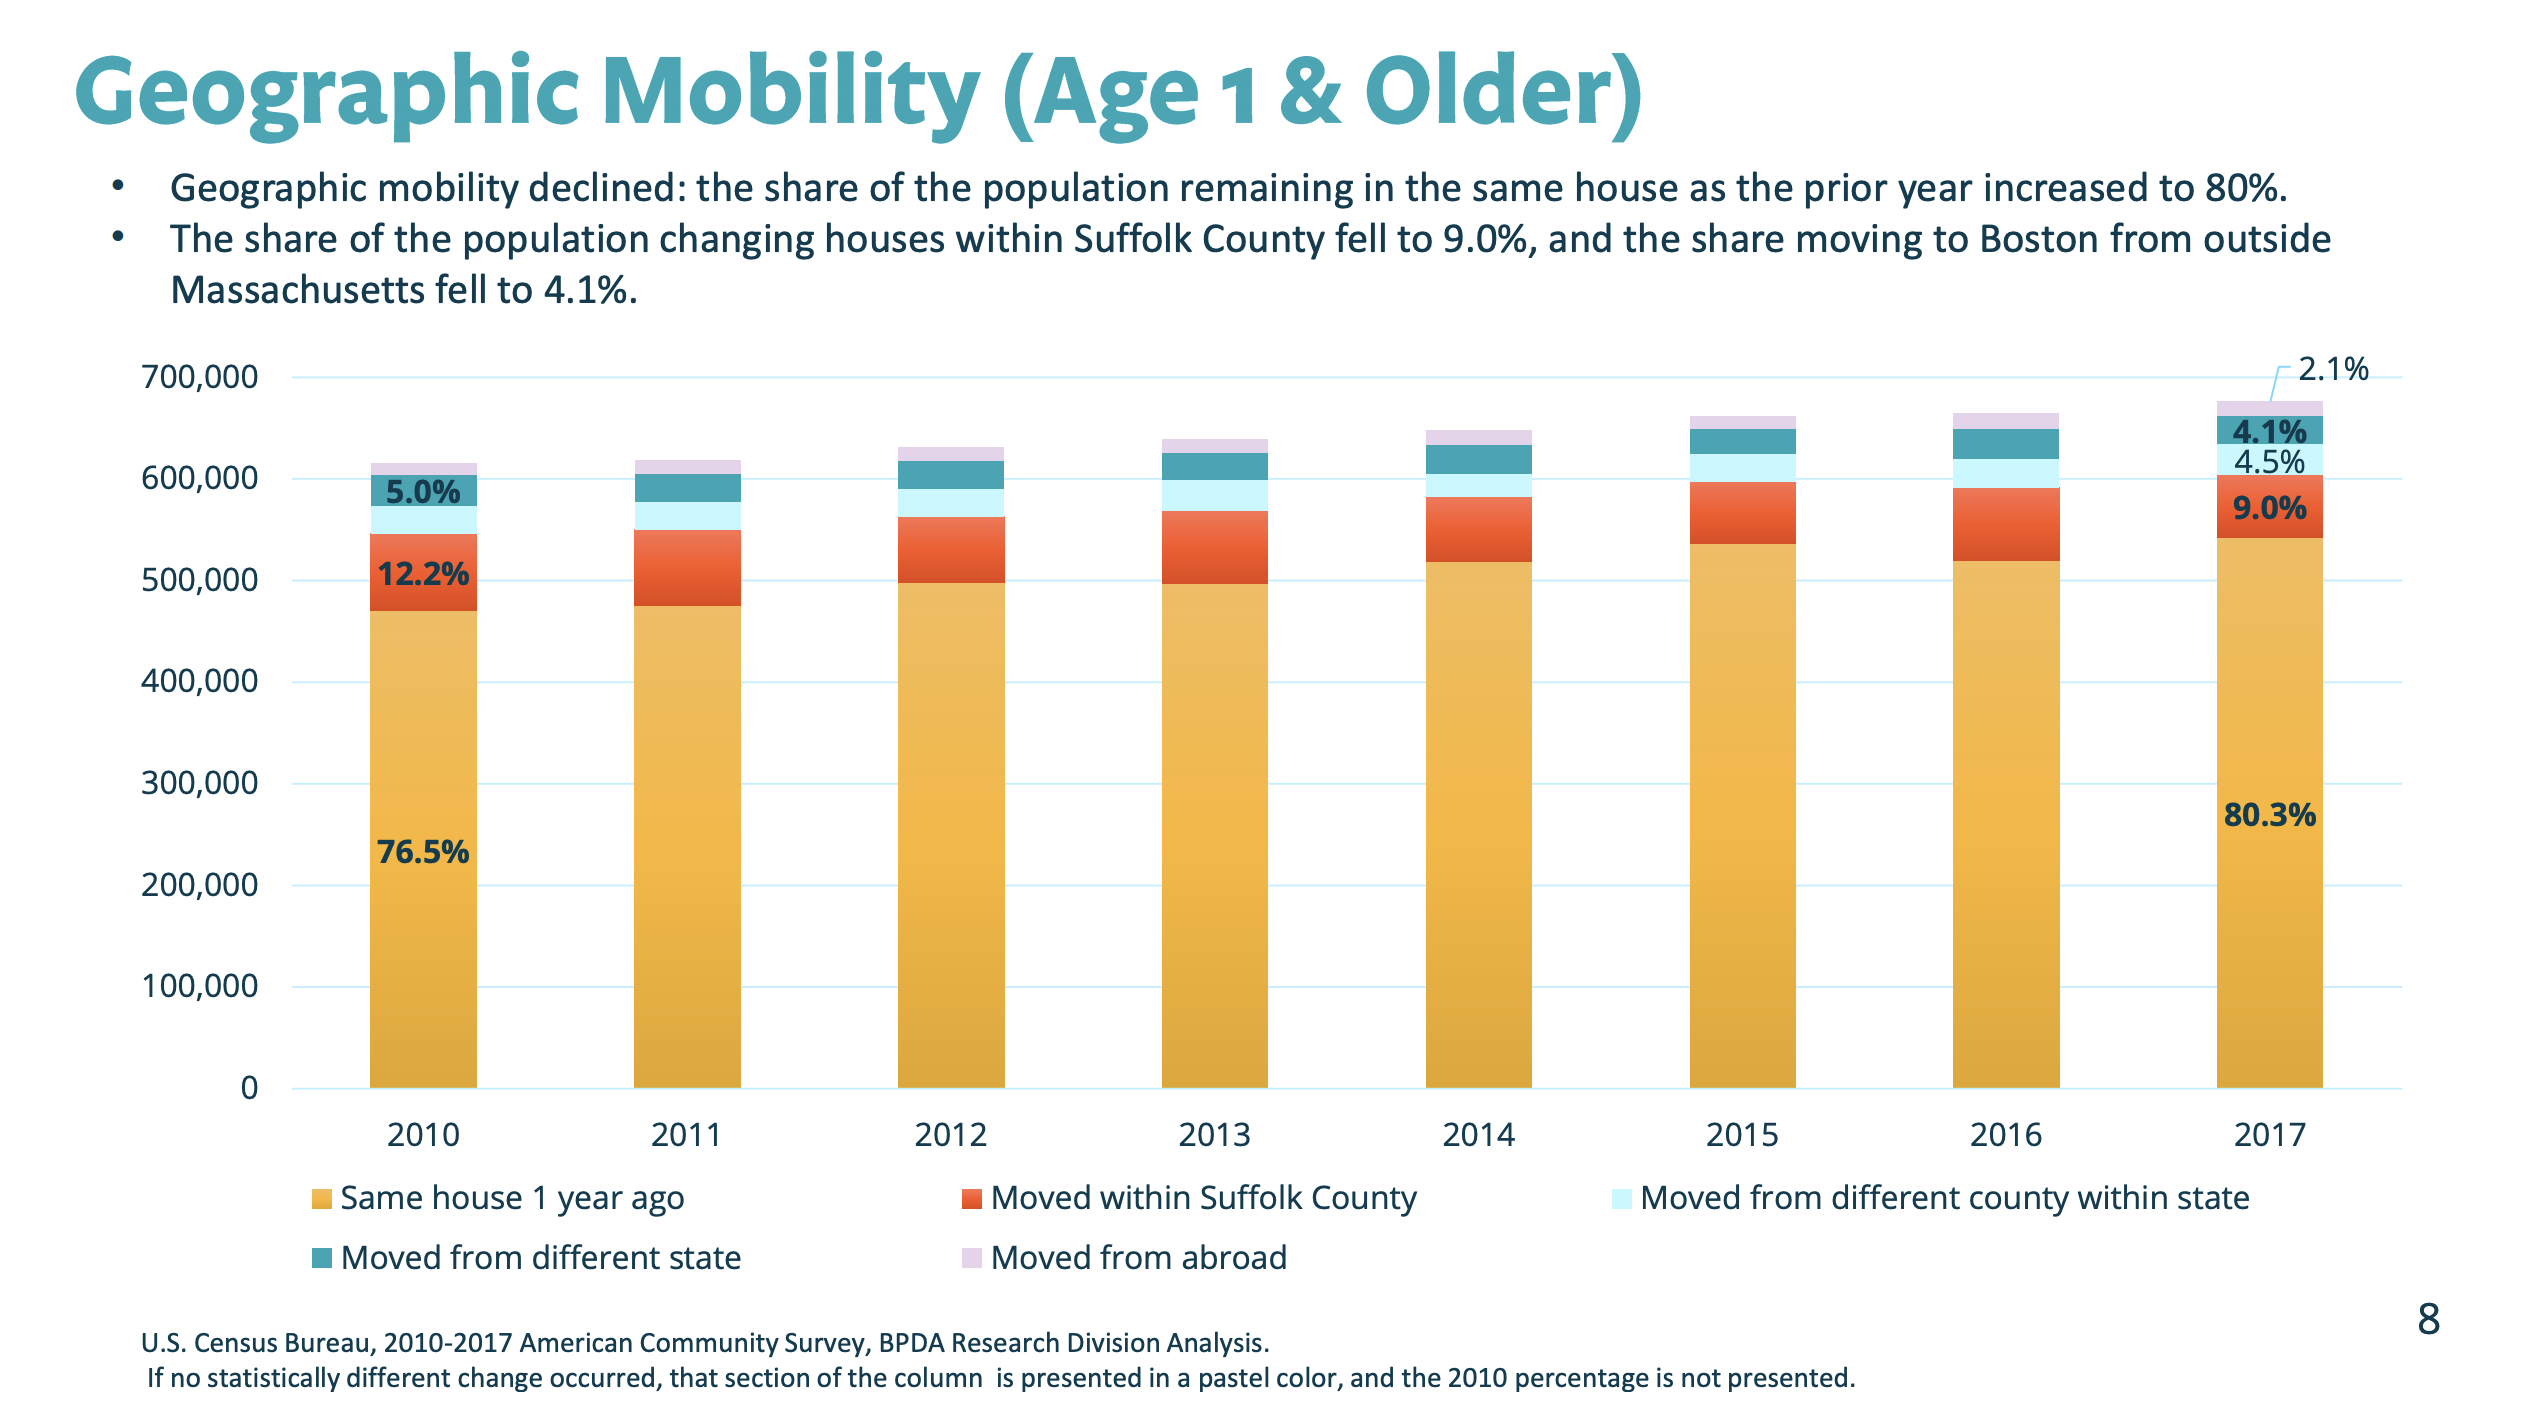
Despite this diverse makeup, Boston households became less geographically mobile over the study’s timeframe. By 2017, more than 80 percent of the city’s population was living in the same house as they were one year earlier, while fewer people reported moving either within Suffolk County or from another state compared to in 2010. At the same time, the city’s share of owner-occupied housing units increased from 32.5 percent to 35.2 percent. While a significant majority of Boston housing units were occupied by renters in 2017 (64.8 percent), that share declined from 2010 levels.
Boston households across all income brackets were earning more money in 2017, even after accounting for inflation. The BPDA report found local households earned at least 17 percent more on average in 2017 than 2010 including inflation. Lower-income households saw their earnings grow more than 20 percent.
Read the full study from the BPDA here.