Boston is one of the least affordable and most competitive housing markets in the country, and recent sales figures show the trend is not slowing.
“Increasingly, we’re having to go back at least a decade to see sales and median prices at the level they’ve hit lately, and March is a perfect example,” Timothy Warren, CEO of The Warren Group, said in a statement. “As the spring market ramps up, we’re going to see these numbers climb, likely to levels at or even above those of the mid-2000s.”
Still, not every area in Boston is seeing rising sales prices. Four out of 12 Boston neighborhoods had decreases in median sales prices in the first quarter in 2017, according to The Warren Group’s recently released analysis of the market.
Here are the four neighborhoods where prices for single-family homes dipped the most in Q1 (and here are the neighborhoods where home prices spiked the most):
1. Roxbury:
| Q1 ’17 sales | Q1 ’16 sales | Median price ’17 | Median price ’16 | Percent change | |
|---|---|---|---|---|---|
| Roxbury | 10 | 3 | $435,000 | $545,000 | -20.18% |
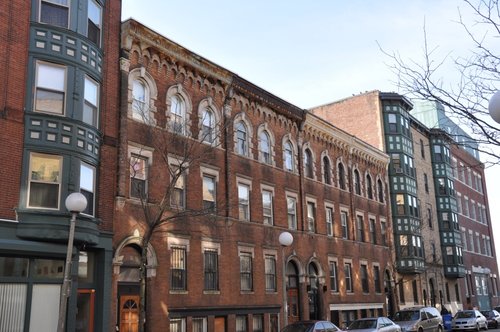
2. Charlestown:
| Q1 ’17 sales | Q1 ’16 sales | Median price ’17 | Median price ’16 | Percent change | |
|---|---|---|---|---|---|
| Charlestown | 13 | 13 | $950,000 | $1.15 million | -17.39% |
3. Brighton:
| Q1 ’17 sales | Q1 ’16 sales | Median price ’17 | Median price ’16 | Percent change | |
|---|---|---|---|---|---|
| Brighton | 5 | 6 | $610,000 | $687,500 | -11.27% |
4. Roslindale:
| Q1 ’17 sales | Q1 ’16 sales | Median price ’17 | Median price ’16 | Percent Change | |
|---|---|---|---|---|---|
| Roslindale | 14 | 13 | $498,000 | $520,000 | -4.23% |