
Trends
For data-driven stories, to appear under “Trends” menu

Some cities fared better than others with the global pandemic and Boston is one of them, according to The Economist’s 2021 Livability Index’s ranking of the most livable cities in the world.
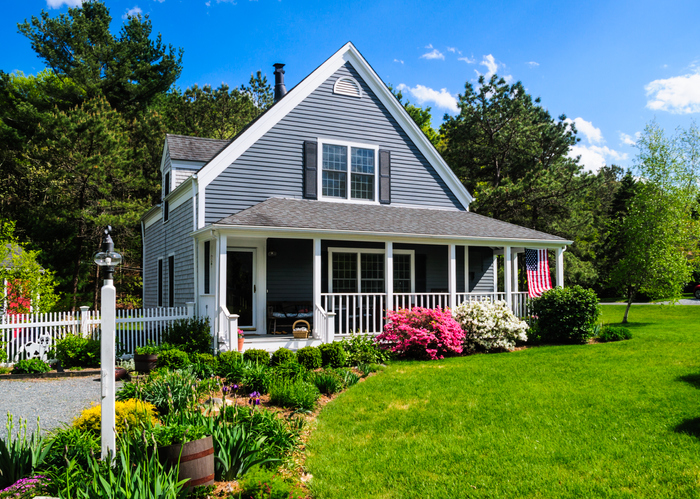
Rising property values had homeowners cashing out of their existing residences to buy bigger homes in less-expensive areas last year, according to a new Zillow analysis of out-of-town moves.
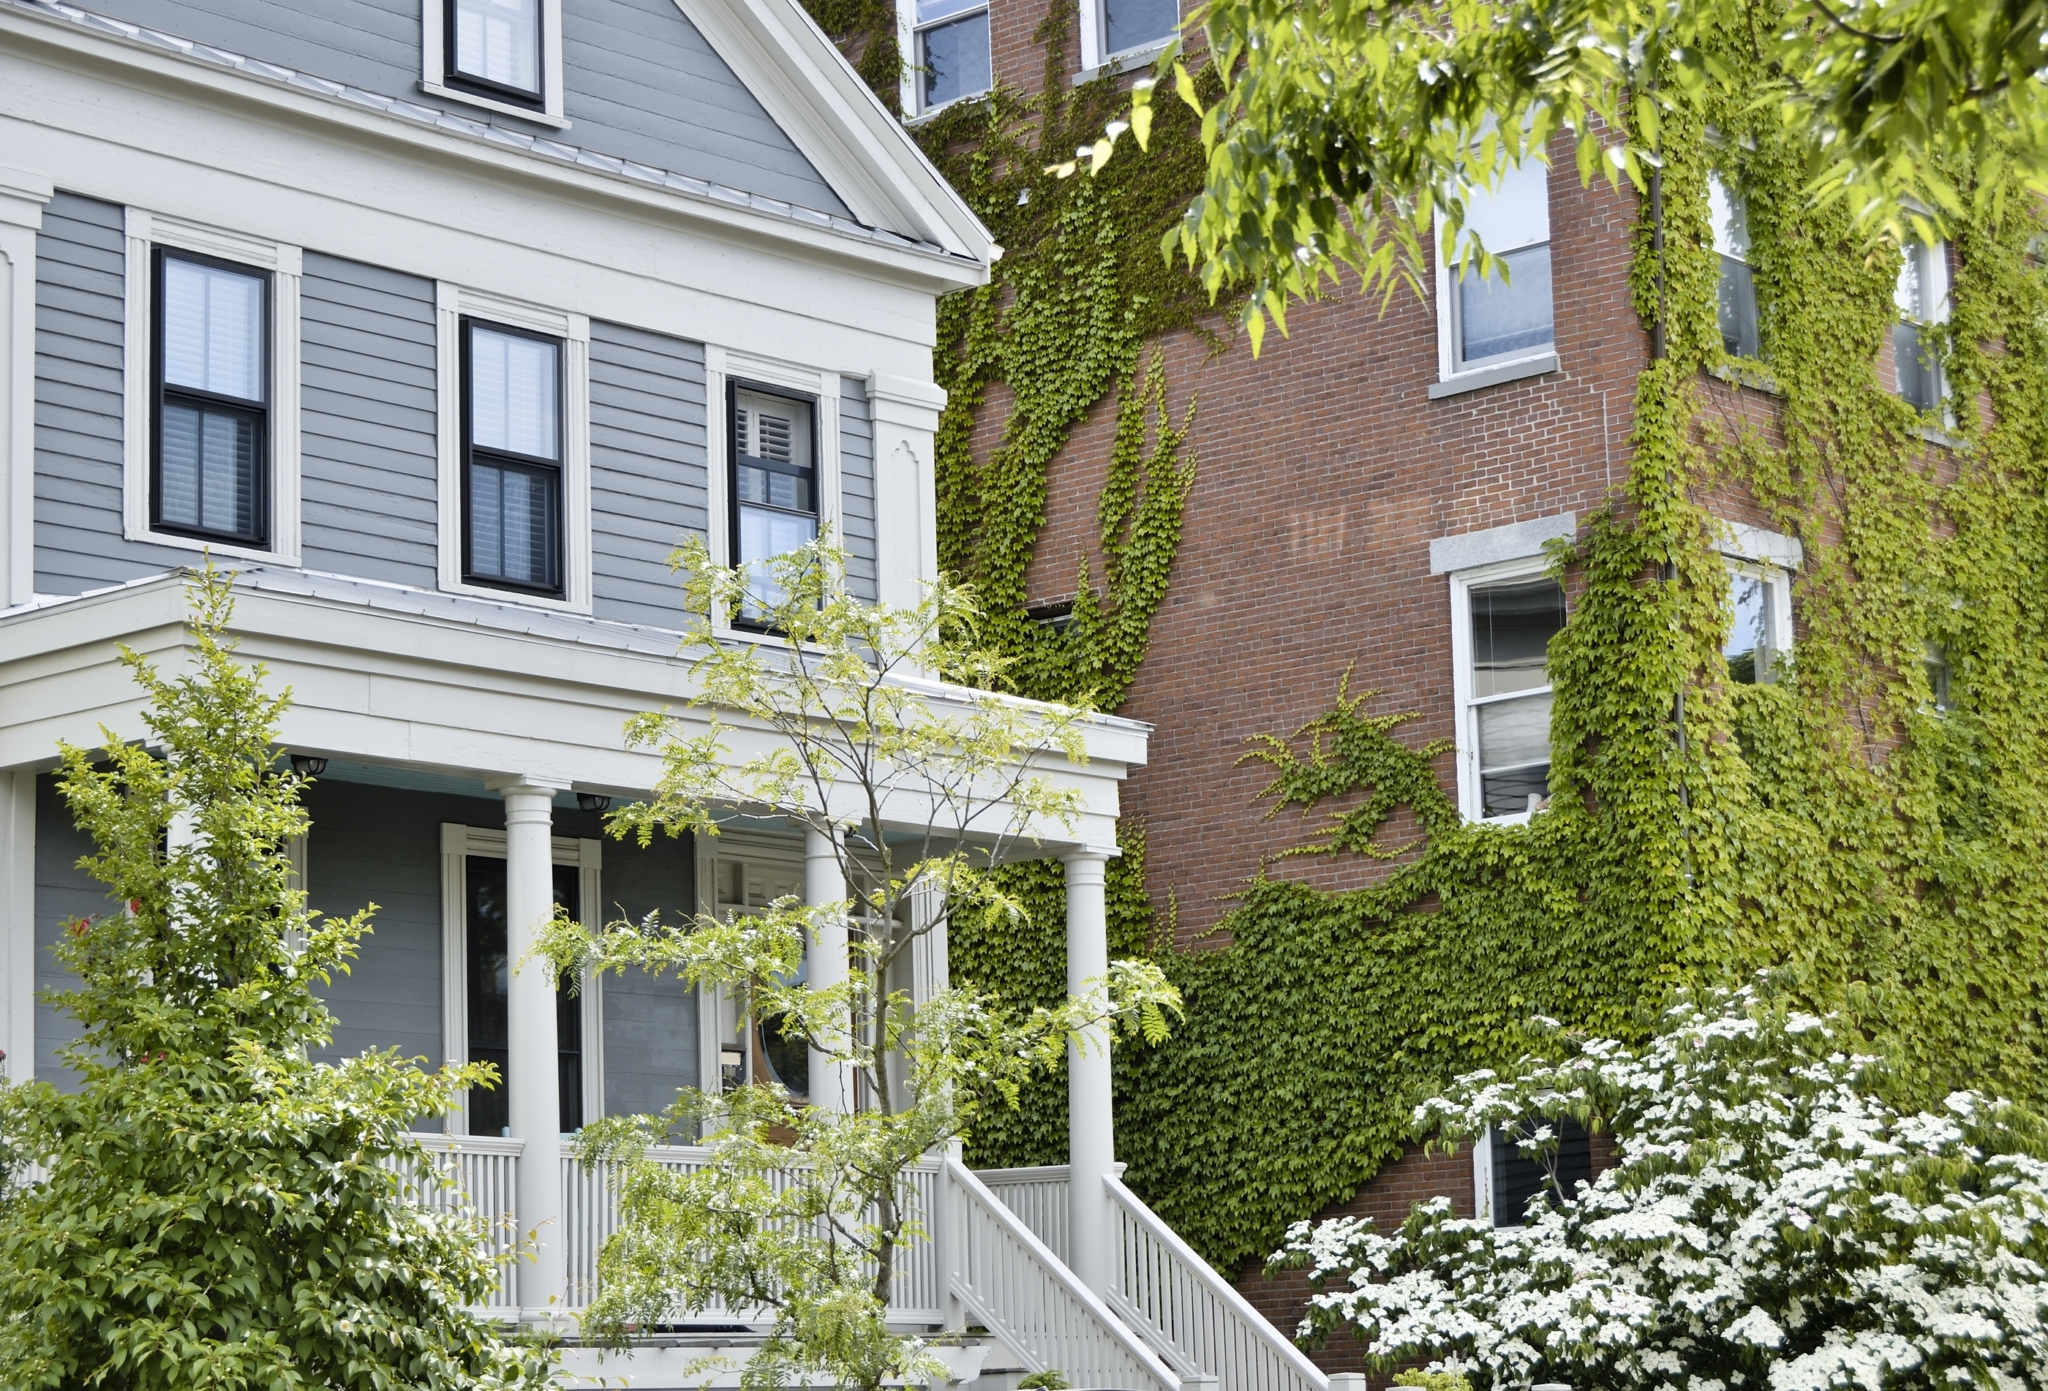
With half of all homes in today’s market selling above the asking price, the timing of when to list can have an impact on both time on market and sale price.
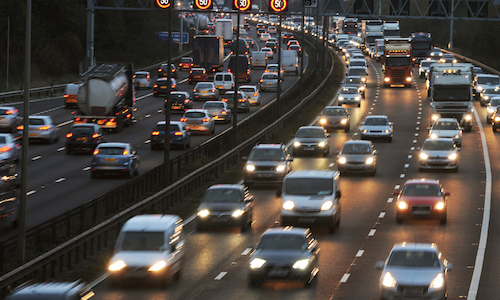
Longer-commute areas continued to claim the largest market share in single-family homebuilding, but the construction growth rate was strongest in places with shorter commuting times, the National Association of Home Builders said, citing its quarterly Home Building Geography Index.
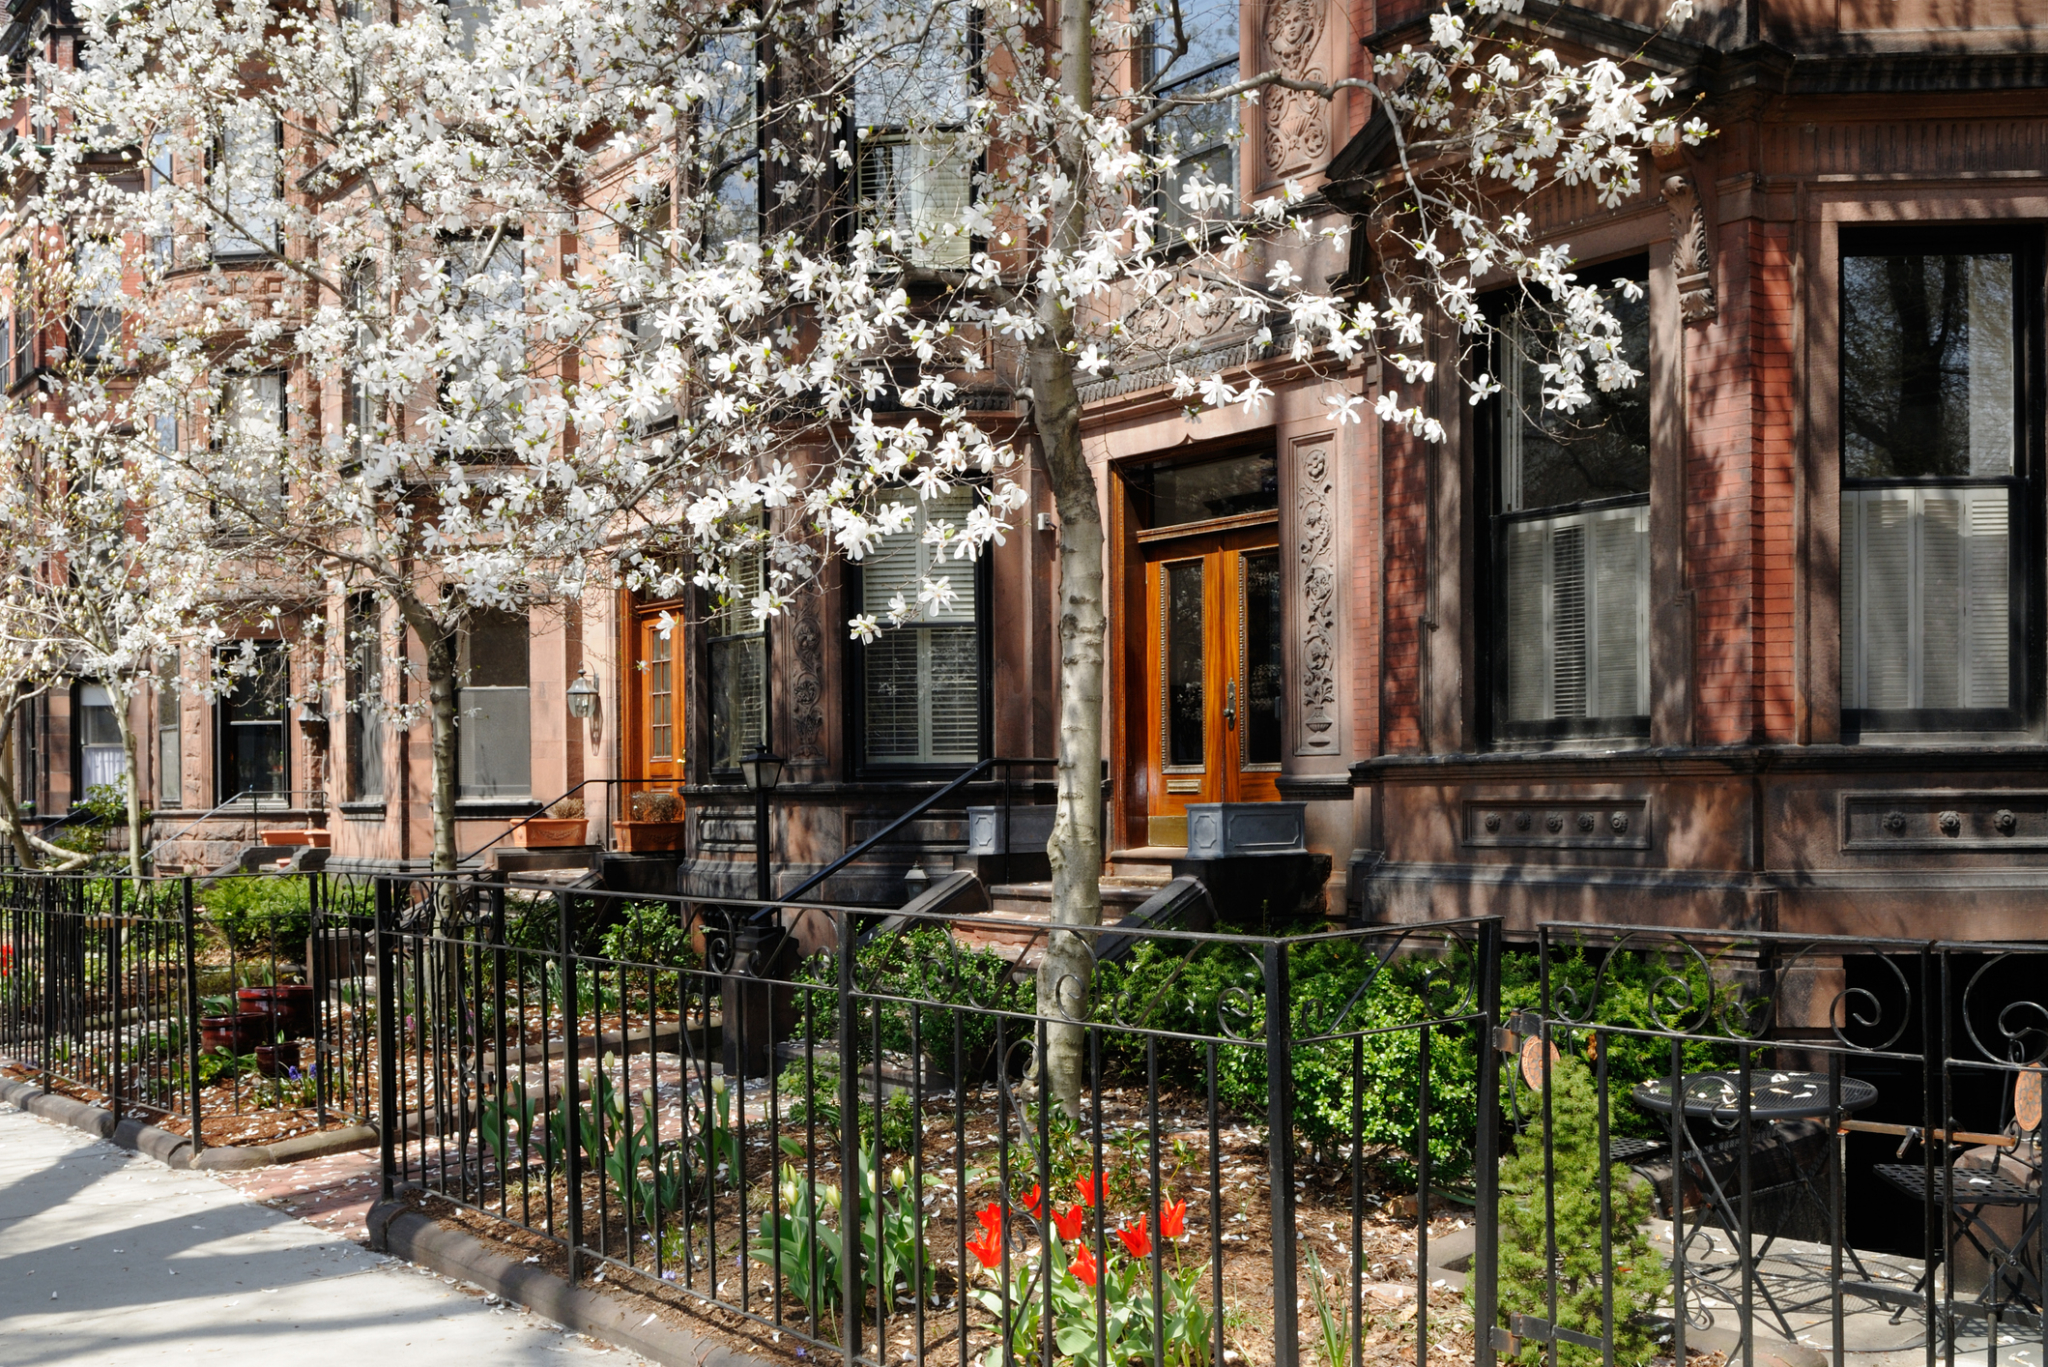
Home-price growth remained in double digits for the 10th straight month in May as inventory lows pushed the median listing prices up 15.2% from last year.
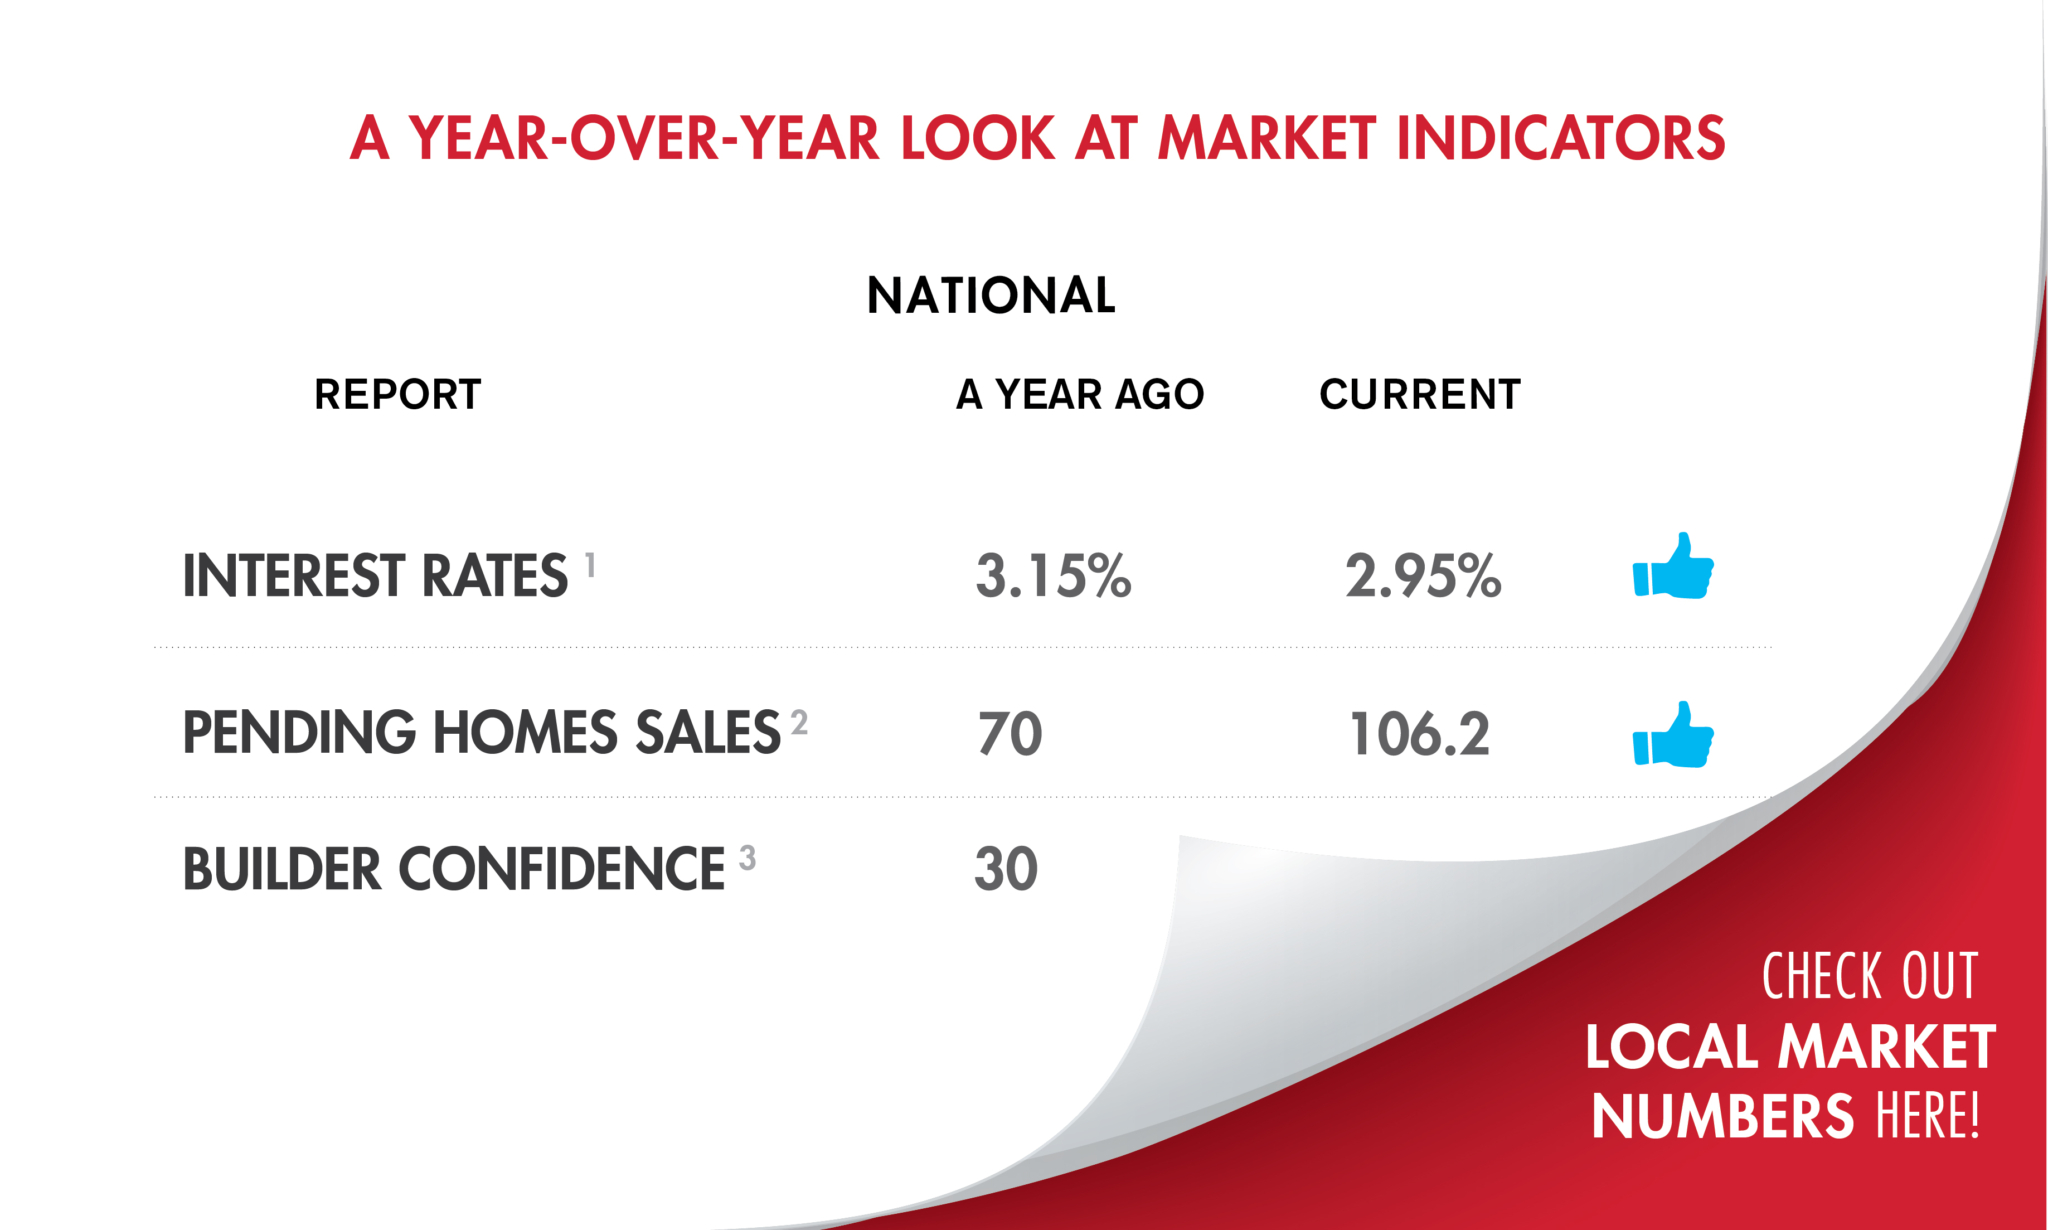
Housing inventory also saw an increase from year-ago levels last month.
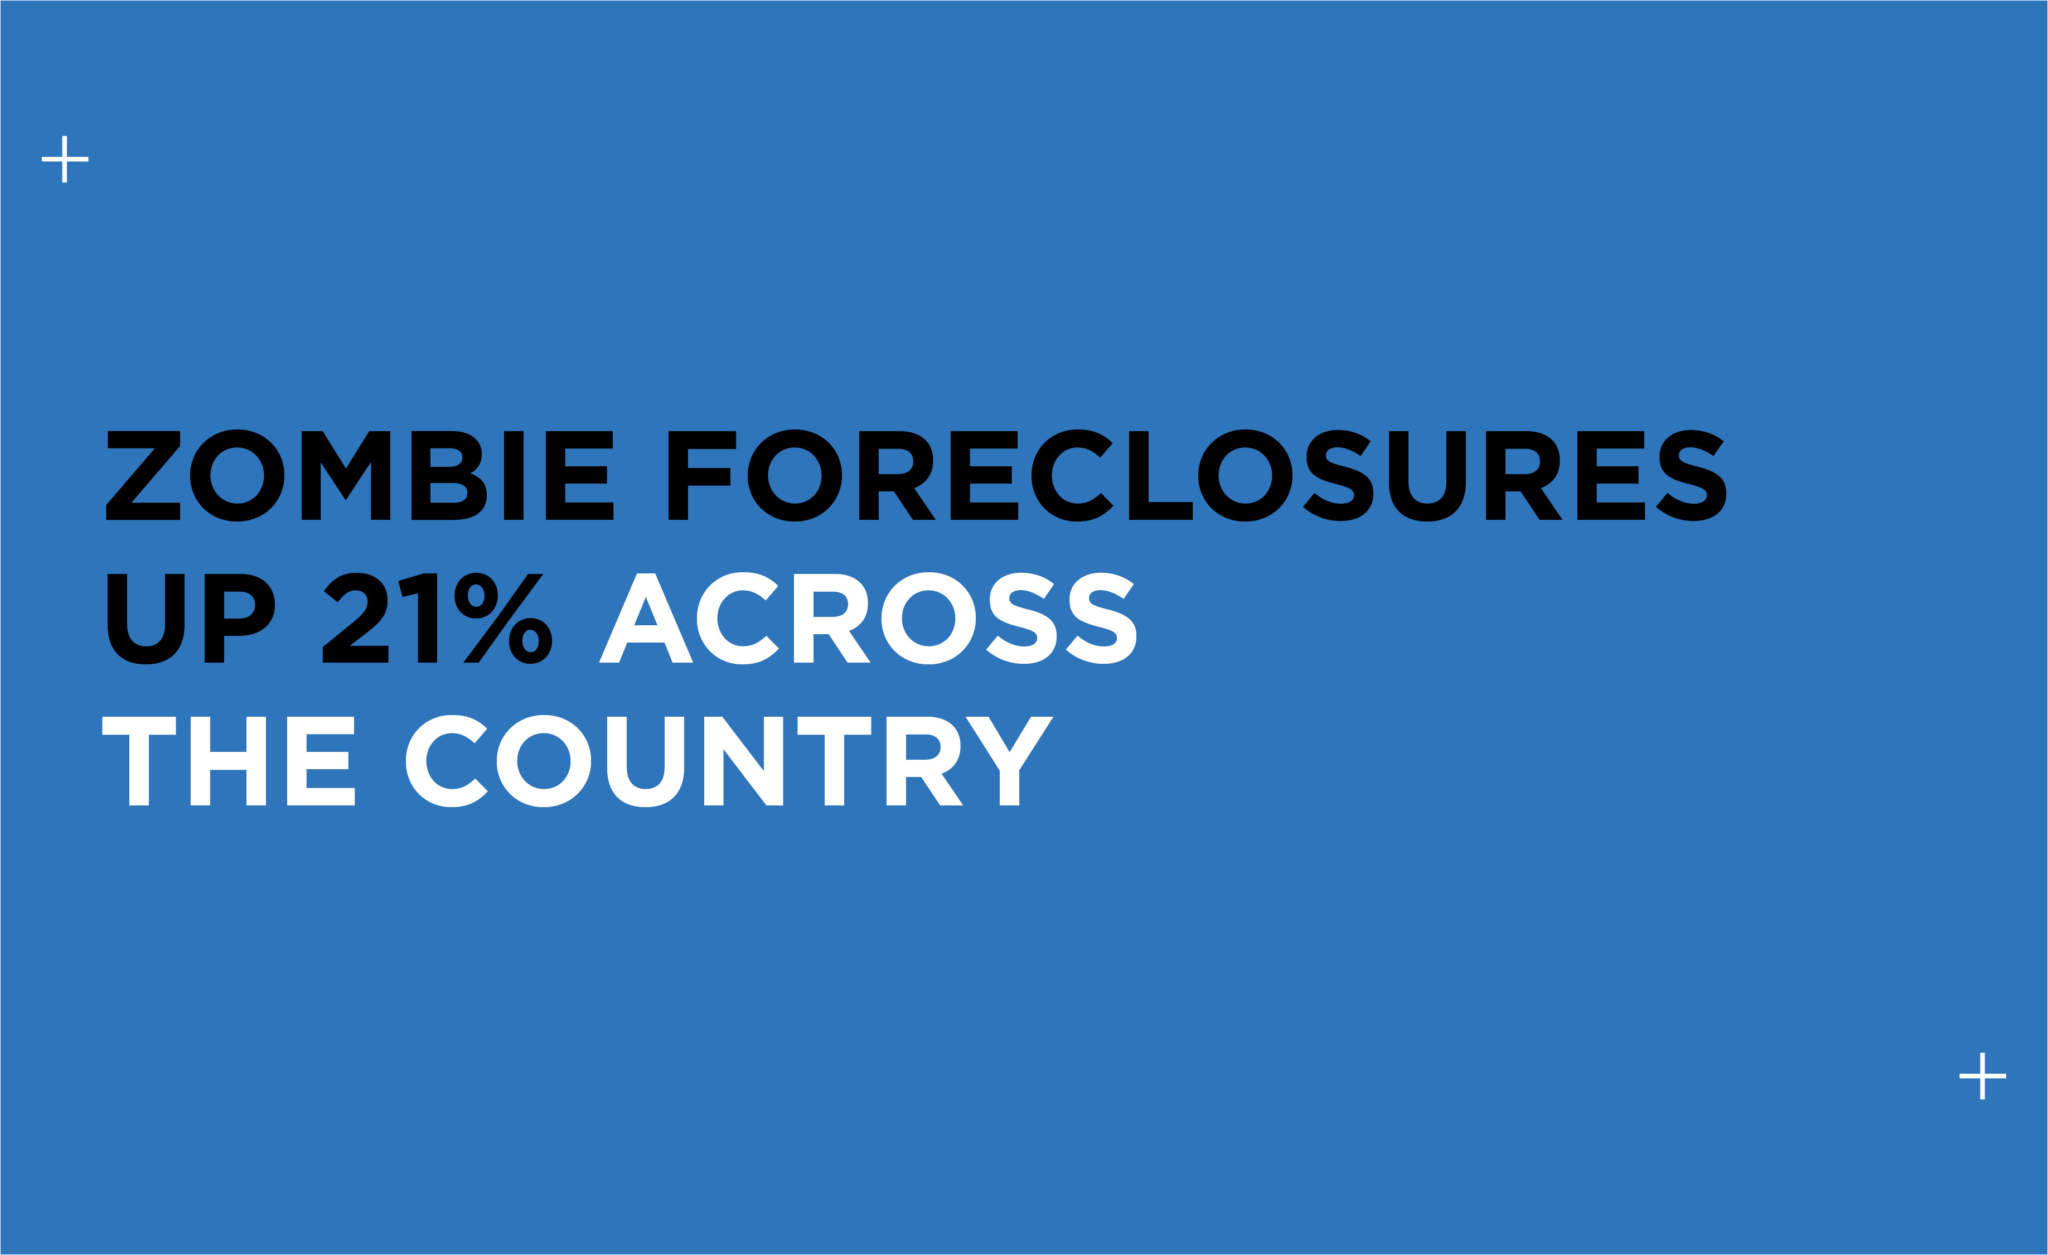
Of the 99 million residential properties in the U.S., approximately 1.4 million (or 1.4%) are vacant this quarter, with “zombie” home rates increasing both quarterly (21%) and annually (5.6%).

“Demand is robust throughout the country, but homebuyers continue to be held back by the lack of homes for sale and rapidly increasing home prices.” — MBA Associate Vice President of Economic and Industry Forecasting Joel Kan
Year over year, however, pending home sales were up 57.1%, the NAR said, citing its monthly Pending Home Sales Index.

City life is reawakening after a year marred by the pandemic, but that doesn’t mean the resurgent demand for homes in the neighboring suburbs is coming down any time soon.

First-time homebuyers found their long-term plans changed due to COVID.

Median home sales prices in Massachusetts continued to rise in April due to strong buyer demand and record-low inventory.

The median sales price of new homes sold in April was $372,400, up from $334,200 in March and $310,100 a year ago.
The pace of housing-price gains in Boston quickened in March, according to the S&P CoreLogic Case-Shiller U.S. National Home Price NSA Index, which showed a 2.6% increase from February and a 14.9% increase from a year earlier, compared to a gain of 0.9% the previous month.

The limited inventory that has plagued the housing market continued, although at an abated pace.

An analysis of 10 years of home sales found the spring and summer months offer the most gains for sellers, particularly the month of May.