By the Numbers

November’s reading of 83 was up three points from October, driven by low existing inventories and strong buyer demand, the National Association of Home Builders reported, citing the latest NAHB/Wells Fargo Housing Market Index.
Housing observers noted that demand for housing remains robust despite the lack of new supply.
According to real estate data provider ATTOM, foreclosure filings, which include default notices, scheduled auctions or bank repossessions, rose 5% in October on a monthly basis and 76% from October 2020, to 20,587 filings.
Seventy-eight percent of the 183 U.S. markets monitored by the National Association of Realtors had double-digit increases in their median home prices, a decline from the second quarter, when 94% of markets saw double-digit increases.

“Mortgage rates decreased for the first time since August, as concerns about supply-chain bottlenecks, waning consumer confidence, weaker economic growth and rising inflation pushed Treasury yields lower.” — MBA associate vice president of economic and industry forecasting Joel Kan
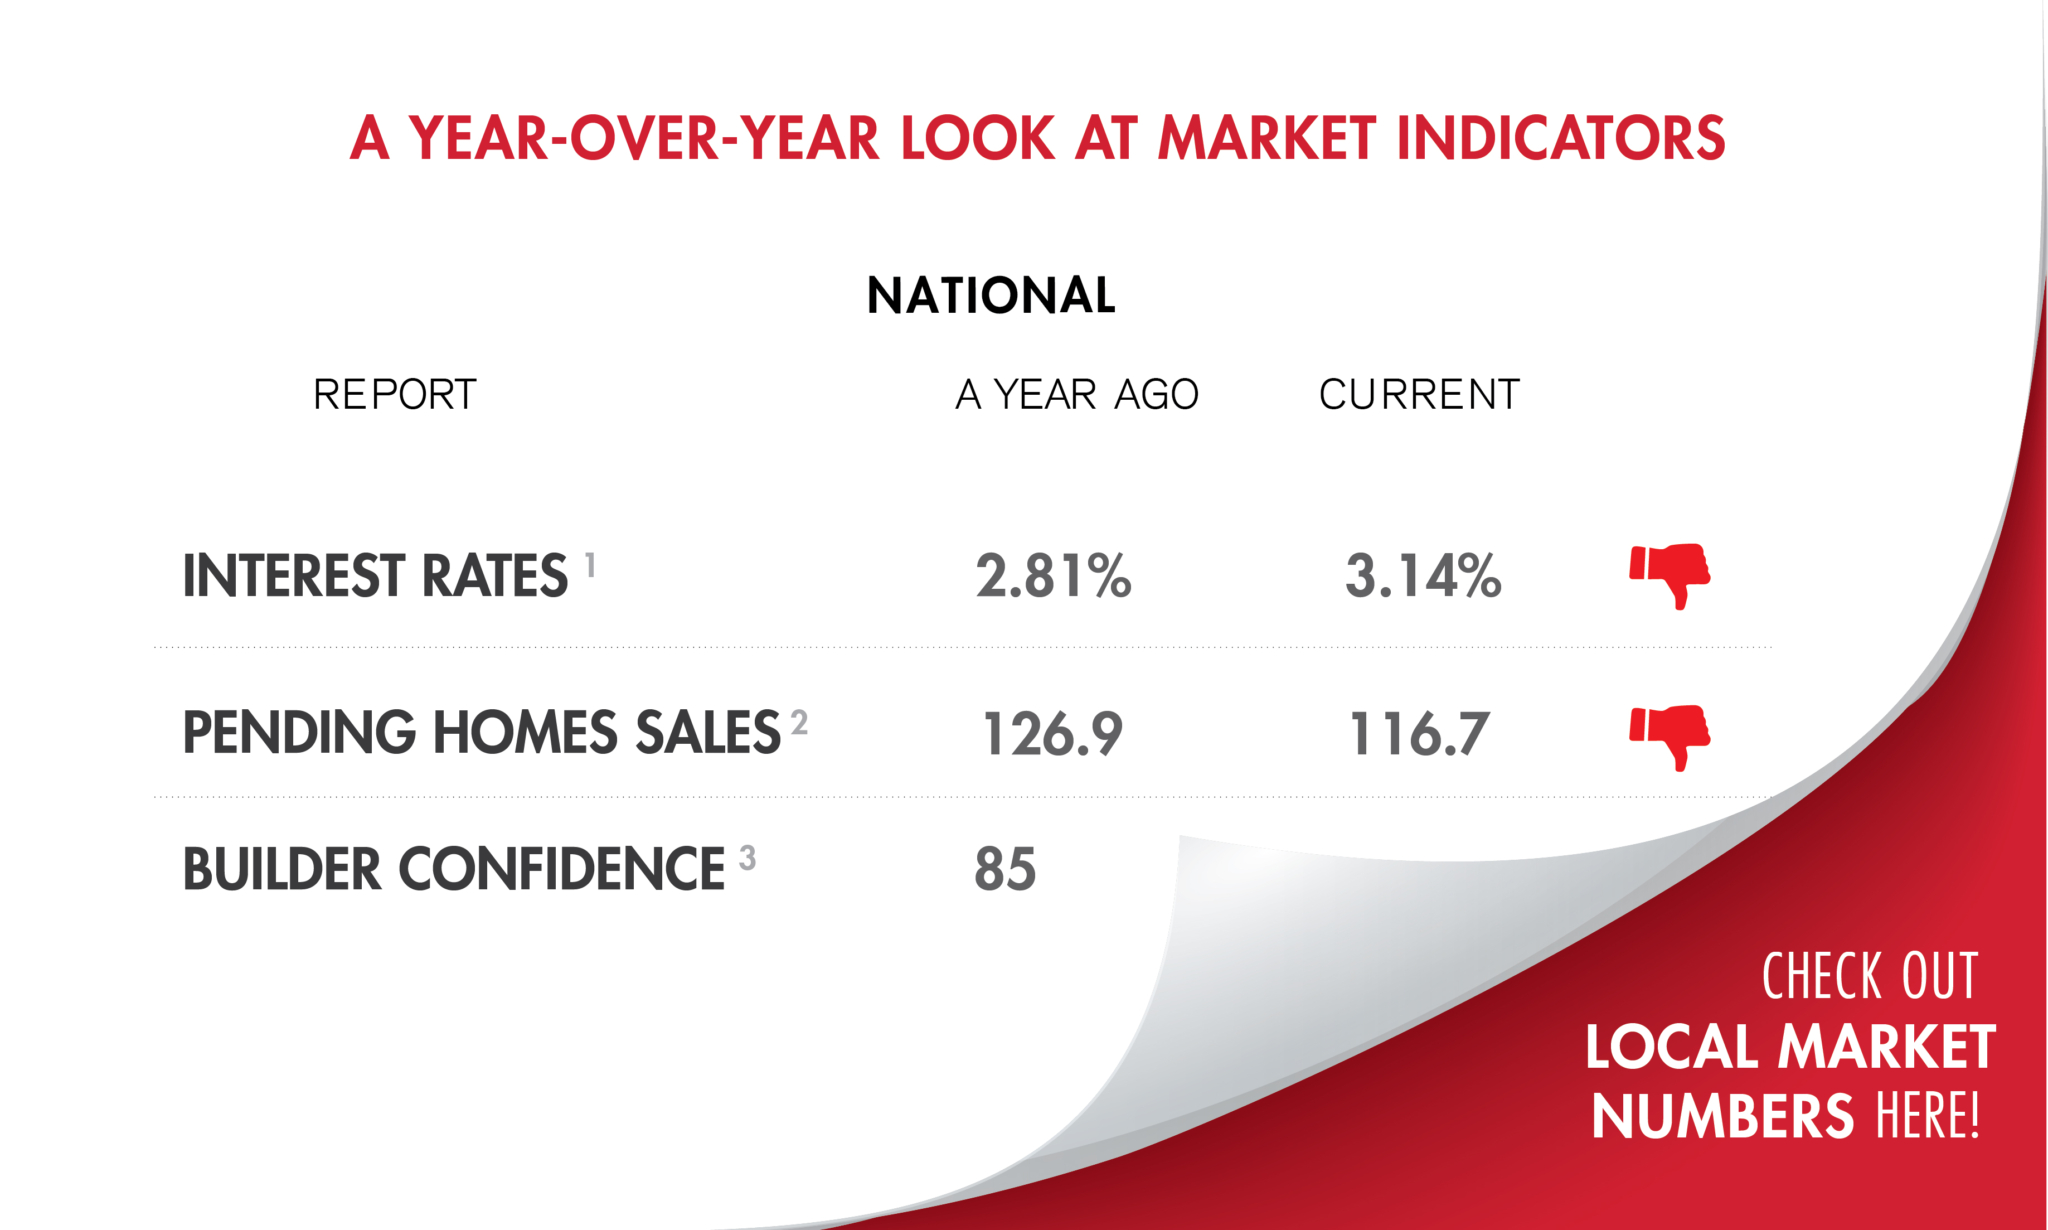
Builder confidence was also down from a year ago.

Boston and Raleigh had the highest bidding-war rates, as the rate fell to a 2021 low.

“Contract transactions slowed a bit in September and are showing signs of a calmer home price trend, as the market is running comfortably ahead of pre-pandemic activity.” — NAR chief economist Lawrence Yun

Home-price gains were once again broadly distributed, as all 20 cities in the S&P CoreLogic Case-Shiller Home Price Index rose, although in most cases at a slower rate than a month ago.

At the same time, the increase in interest rates drove fewer borrowers to refinance their loans, according to the Mortgage Bankers Association.
“There simply aren’t enough homes for sale relative to the demand fueled by millennials armed with low mortgage rate-driven house-buying power.” — First American Deputy Chief Economist Odeta Kushi

The month also saw a slight shift in inventory, even though shortages continued.
The median existing-home price for all housing types in September was $352,800, up 13.3% on an annual basis, as every region in the country registered price increases.
The decrease was driven by a 5.1% month-over-month slide in the rate of multifamily starts, while single-family construction was flat.
The number of closed sales fell 12% month over month, while active inventory rose 5.6% to 7,362. Median sales prices dropped 4.8%, but that’s still up 7.3% from September 2020.

Cape Cod’s housing market remained historically strong in September, despite declines from last year.