See our chart below for the top-selling housing markets in Greater Boston in August, according to research from GBAR.
Click on the tabs to adjust between suburban and city housing markets.
| Neighborhood | Home Sales | YOY Change |
|---|---|---|
| Jamaica Plain | 60 | -4.76% |
| South Boston | 49 | -37.97% |
| South End/Bay Village | 44 | -27.87% |
| Hyde Park/Roslindale | 40 | -24.53% |
| Roxbury | 38 | 18.75% |
| Suburb | Home Sales | YOY Change |
|---|---|---|
| Newton | 121 | 1.68% |
| Brookline | 92 | -7.07% |
| Cambridge | 94 | 1.08% |
| Waltham | 83 | 10.67% |
| Somerville | 74 | 5.71% |
| Medford | 74 | 54.17% |
| Tewksbury | 61 | 27.08% |
| Arlington | 60 | -13.04% |
| Lexington | 60 | 0.00% |
| Melrose | 53 | 15.22% |
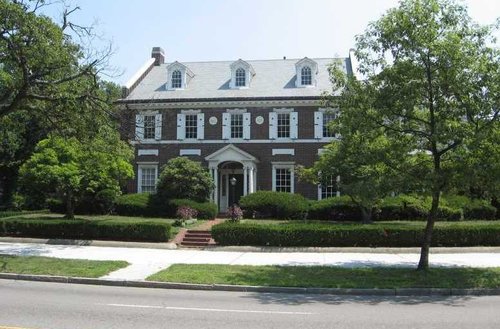
Photo Credit: John Phelan, Creative Commons Attribution 3.0 Unported, https://commons.wikimedia.org/wiki/File:Windermere_Rd,_Newton_MA.jpg