By the Numbers

More buyers are touring homes and applying for mortgages as the 2024 housing market enters its home stretch, according to a new Redfin report.
Boston is the fourth-priciest rental market in the country, according to Zumper’s November National Rent Report.
A year-over-year look at some of the key metrics in Boston’s residential real estate market.

Despite the new record in September, the rate of increase continues to slow.

The new findings come from real estate tech strategist Mike DelPrete.

The increase follows two months of declines, the National Association of REALTORS® said.

Multifamily construction, meanwhile, rose on a monthly basis.

Looking ahead, the CoreLogic Home Price Insights report predicts home prices will dip by 0.1% in October on a month-over-month basis.

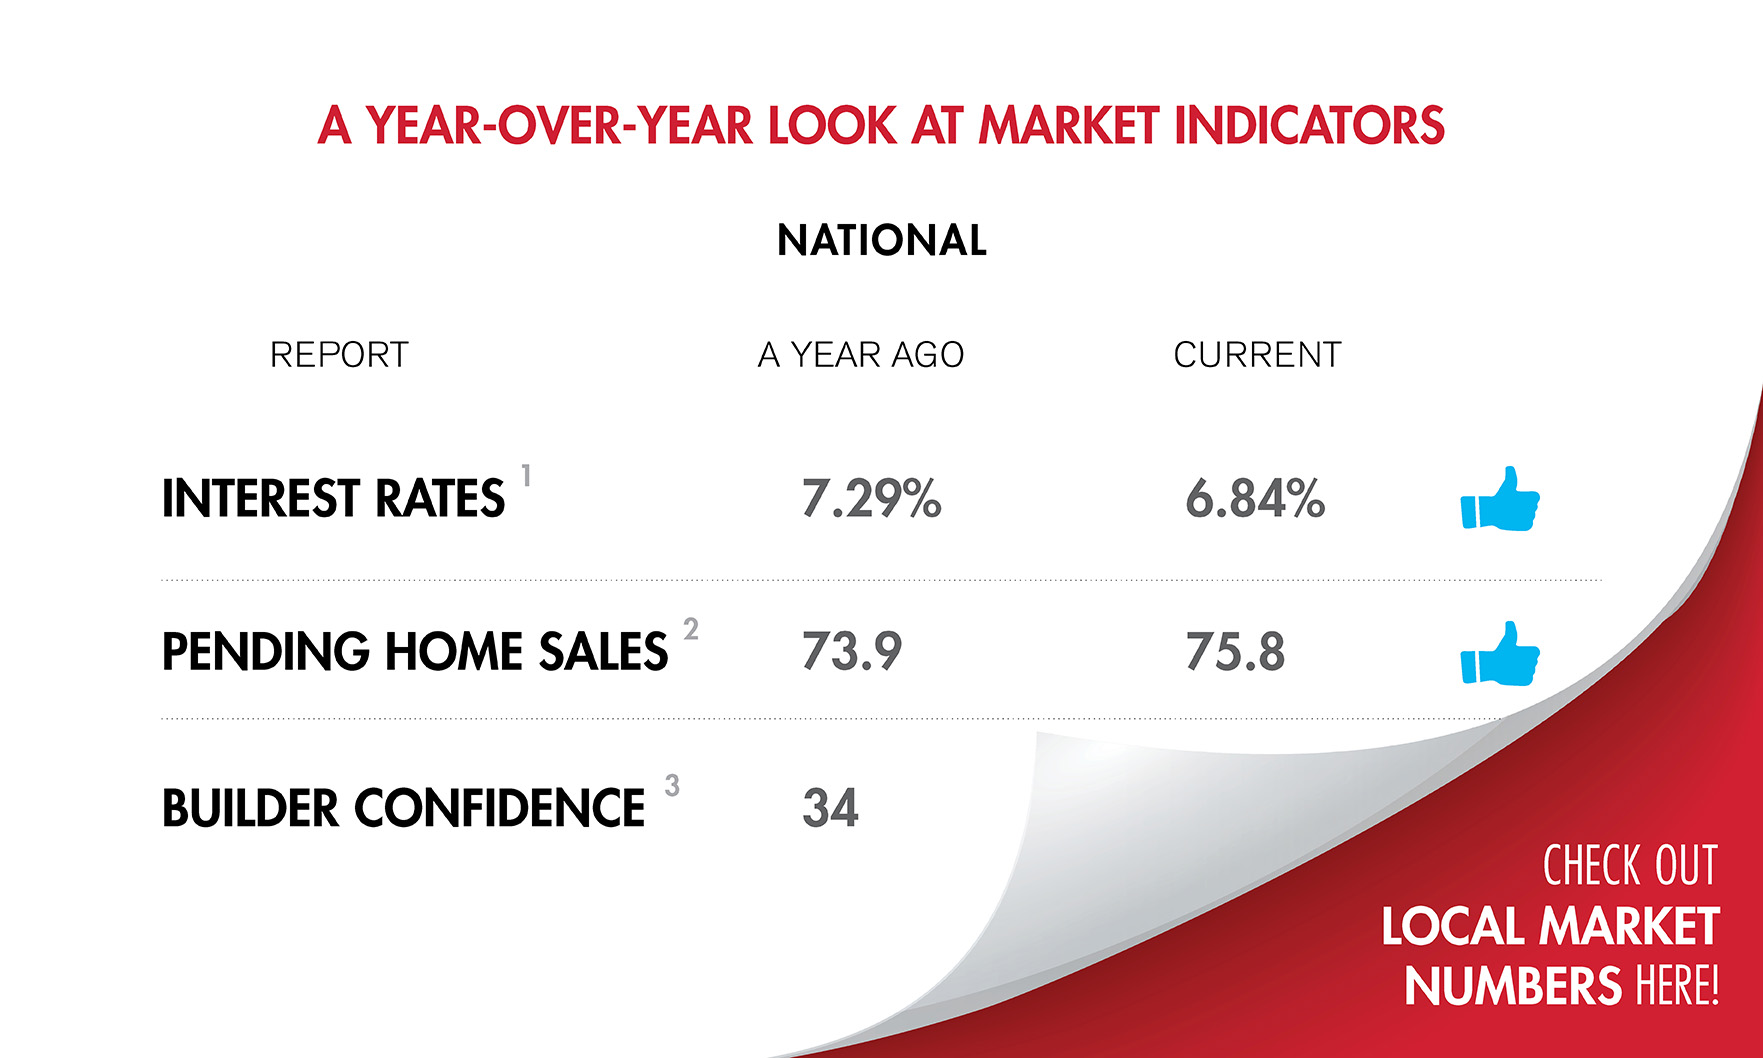
Nationally, interest rates fell as builder confidence rose last month.

The S&P CoreLogic Case-Shiller U.S. National Home Price Index hit a new record in August, marking the 15th month in a row of new highs.

The median price of a new home sold during the month was also up, according to the U.S. Census Bureau and the U.S. Department of Housing and Urban Development.
Sales slid 1% compared to August, the National Association of REALTORS® said.

Multifamily starts, meanwhile, declined, the U.S. Census Bureau and the U.S. Department of Housing and Urban Development said.

October’s increase comes as inflation slows and mortgage rates decline.
At the same time, the median-sales price declined from August, according to the RE/MAX National Housing Report.

The latest reading of the National Association of REALTORS® Pending Home Sales Index shows a return to month-over-month growth after a decline in July.