Boston may not be the least affordable housing market in the U.S., but it’s awfully close.
That was the finding of a new analysis from Redfin. As of July 2016, the median price for a two-to-four-bedroom home in Beantown is $837,000; with those high prices, only 20 percent of Boston’s housing stock is affordable to the working class. Indeed, only four cities – San Francisco, Los Angeles, San Diego and San Jose – are less affordable than Boston.
But which areas in Boston are particularly unaffordable in 2016? To find out, we consulted a couple different data sources, and created two charts with those numbers. Below, we’ve ranked both the 10 costliest rental markets (courtesy of numbers from Zumper), and the 10 priciest condo markets (courtesy of GBAR stats).
| Neighborhood | Median Sales Price YTD (Condos) |
|---|---|
| Midtown/Theatre District | $1,435,000 |
| Back Bay | $1,050,000 |
| South End/Bay Village | $827,500 |
| Chinatown/Leather District | $822,000 |
| Brookline | $772,500 |
| Beacon Hill | $731,543 |
| Newton | $697,000 |
| Cambridge | $695,000 |
| South Boston | $632,500 |
| Charlestown | $614,000 |
| Neighborhood | Median Rent (One-Bedroom) |
|---|---|
| Downtown | $3,150 |
| D Street/West Broadway | $3,000 |
| East Cambridge | $2,900 |
| South End/Bay Village | $2,725 |
| Cambridgeport | $2,700 |
| Back Bay | $2,675 |
| West End | $2,660 |
| MIT | $2,600 |
| Chinatown/Leather District | $2,600 |
| Lower Roxbury | $2,600 |
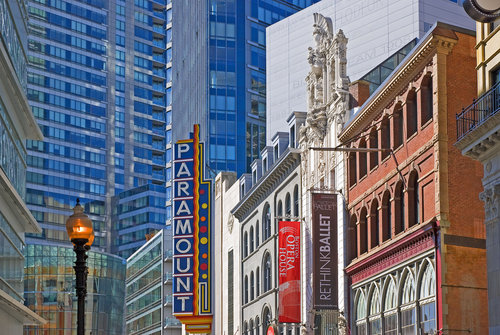
Creative Commons: Ron Cogswell, http://commons.wikimedia.org/wiki/File:2011_BostonOperaHouse_Massachusetts_6244579324.jpg

