While the homeownership rate in the United States grew between 2013 and 2023, with all racial and ethnic groups seeing gains, gaps between groups persist. In fact, the gap between Black homeownership rates and the other groups’ actually grew over the past decade — despite Black homeowners posting the largest increase of all groups in 2023 — according to the National Association of REALTORS’® (NAR) annual Snapshot of Race and Home Buying in America.
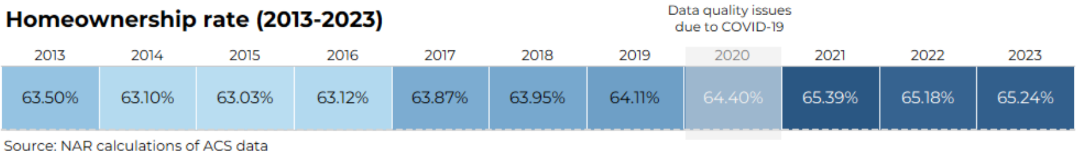
Among the major racial groups combined — Asian, Black, Hispanic and white — the homeownership rate grew from 63.5% in 2013 to 65.2% in 2023. That translates to 11.8 million more homeowners in 2023, the latest year for which NAR’s data, drawn from the Census Bureau’s yearly American Community Survey, was available.
While the change in the rate between 2013 and 2023 shows an overall increase, it was not steady, with year-over-year dips in 2014, 2015 and, most recently, 2022. The swing back to positive territory in 2023 came thanks to strong demographic shifts and wage growth. This is in spite of high mortgage rates and housing markets hitting their lowest point in almost 30 years, NAR said.
Courtesy of the National Association of REALTORS®.
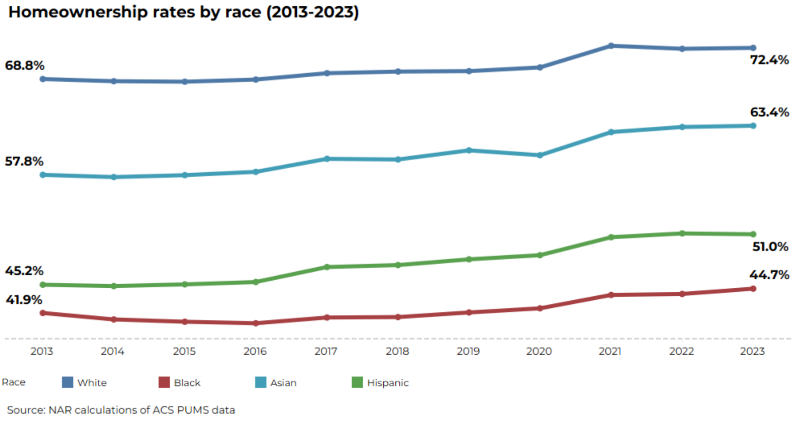
All racial groups saw increases in homeownership during the 10-year period, although the Black homeownership rate remained stubbornly low compared to the others. Meanwhile, the white homeownership rate remained higher than that of all the races combined, but its rate of growth was not the greatest.
Hispanic
That designation went to Hispanic Americans, who saw their rate of homeownership grow 5.8%, from 45.2% in 2013 to 51% in 2023. The increase represents over 3.5 million more Hispanic homeowners. NAR attributed the increase to strong population growth and rising household incomes.
Geographically, the Hispanic homeownership rate was highest in New Mexico (67%), Vermont (66%) and Michigan (63%) in 2023, while it was lowest in North Dakota (26%), New York (28%) and Washington, D.C. (30%).
Asian
Asian Americans were close behind their Hispanic neighbors in terms of rising homeownership, with an increase of 5.6%, from 57.8% to 63.4%, which translates into 1.6 million more Asian households owning a home. The growth in the rate suggests economic stability and educational attainment played significant roles in boosting home purchases among this demographic, NAR said.
By state, the Asian homeownership rate was highest in Hawaii (75%), Florida (74%) and Maryland (73%) in 2023 and lowest in North Dakota (30%), Washington, D.C. (38%) and West Virginia (39%).
White
The rate of white American homeownership had the third-highest increase, a 3.6% gain from 68.8% to 72.4%. While that rise means about 702,200 more white homeowners, it comes as the overall white population slid by roughly 3.4 million during the decade of study. NAR noted that the population decline mostly occurred among white renters, who saw their numbers fall almost 15%, while white homeowners increased.
White homeownership was highest in Delaware (81%), Mississippi (80%) and South Carolina (80%), while it was lowest in Washington, D.C. (48%), Hawaii (58%) and California (63%).
Black
Black Americans saw the lowest growth in homeownership during the decade, rising by just 2.8%, or about 1.2 million Black homeowners. In fact, the gap between Black homeownership and that of other racial groups was greater in 2023 than it was in 2013.
This is despite Black homeownership posting the largest annual gain among racial groups in 2023: 0.6 percentage points compared to 0.1 percentage points for Asian and white homeownership and a decline of 0.1 percentage points for Hispanic.
The difference between the Black and white homeownership rates — the greatest among any two racial groups — grew 0.8 percentage points from 26.9% in 2013 to 27.7% in 2023. The difference between the Black and Asian rates grew 2.8 percentage points from 15.9% in 2013 to 18.7% in 2023, and the difference between the Black and Hispanic rates grew 3 points from 3.3% to 6.3%.
The Black homeownership rate was highest in Mississippi (58%), Delaware (56%) and South Carolina (56%), while it was lowest in North Dakota (10%), Montana (20%) and Maine (21%).
Courtesy of the National Association of REALTORS®.
Challenges to homeownership
NAR’s Snapshot cited three primary factors affecting a racial group’s homeownership rate: affordability, access to credit and demographics.
When it comes to affordability for first-time homebuyers, Black renters face bigger affordability challenges than white renters in 46 of 51 states, including Washington, D.C. For other minorities, however, the situation is different. Affordability is higher for Asian renters than white renters in 42 states, while it is higher for Hispanic renters in 17 states.
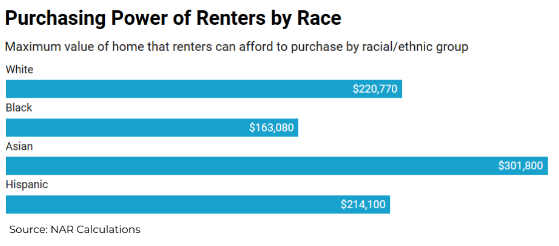
Purchasing power for first-time homebuyers paints a similar picture. Asian renters have the most purchasing power and can generally afford first homes priced at $301,800 and up, followed by white renters, at $220,770; Hispanic renters, at $214,100; and Black renters, at $163,080.
Courtesy of the National Association of REALTORS®.
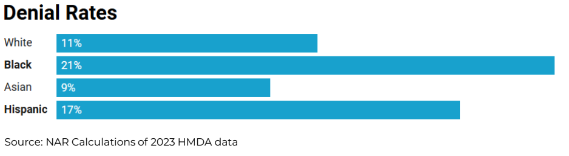
Access to mortgage financing is also a critical component for homebuyers, and again, Black buyers are at a disadvantage. According to Home Mortgage Disclosure Act data, mortgage applications were denied at a rate of 21% for Black applicants, 17% for Hispanic applicants, 11% for White applicants and 9% for Asian applicants.
The rate of mortgage-application denial varies widely state by state. Black and Hispanic applicants faced approval gaps of 21 and 8 percentage points compared to white applicants in South Carolina, while there was little variation in mortgage approvals in Kentucky, Wyoming and Hawaii, according to the Snapshot.
Courtesy of the National Association of REALTORS®.
Other demographic trends can also significantly impact different races when it comes to homeownership. A younger population can indicate increases in homeownership lie ahead, while an aging population can mean a stable or sustained ownership rate for future generations.
Courtesy of the National Association of REALTORS®.
Courtesy of the National Association of REALTORS®.
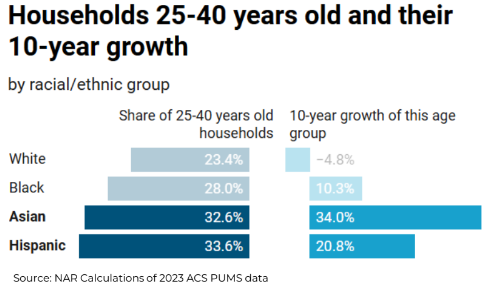
Currently, Hispanic and Asian populations have younger age distributions, meaning a greater percentage is reaching the typical home-buying age, with a concurrent increase in homeownership. About one-third of Asian and Hispanic households are between 25 and 40 years old, while 28% and 23.4% of Black and white households were in that age group, respectively.
“Non-white home buyers are more likely to be first-time buyers, underscoring the importance of changing demographics and the age of local populations, which will increase non-white homeownership over time,” said Jessica Lautz, NAR deputy chief economist and vice president of research.
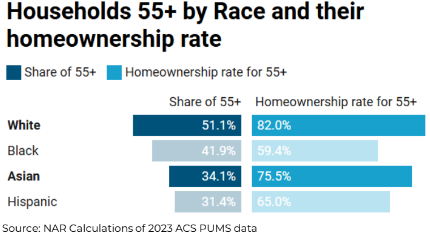
At the same time, White and Asian Americans have significant homeowning populations aged 55 and older, which can mean intergenerational wealth transfers that allow younger generations to own homes, either by home inheritance or financial assistance for down payments, NAR said.
Discrimination in homebuying
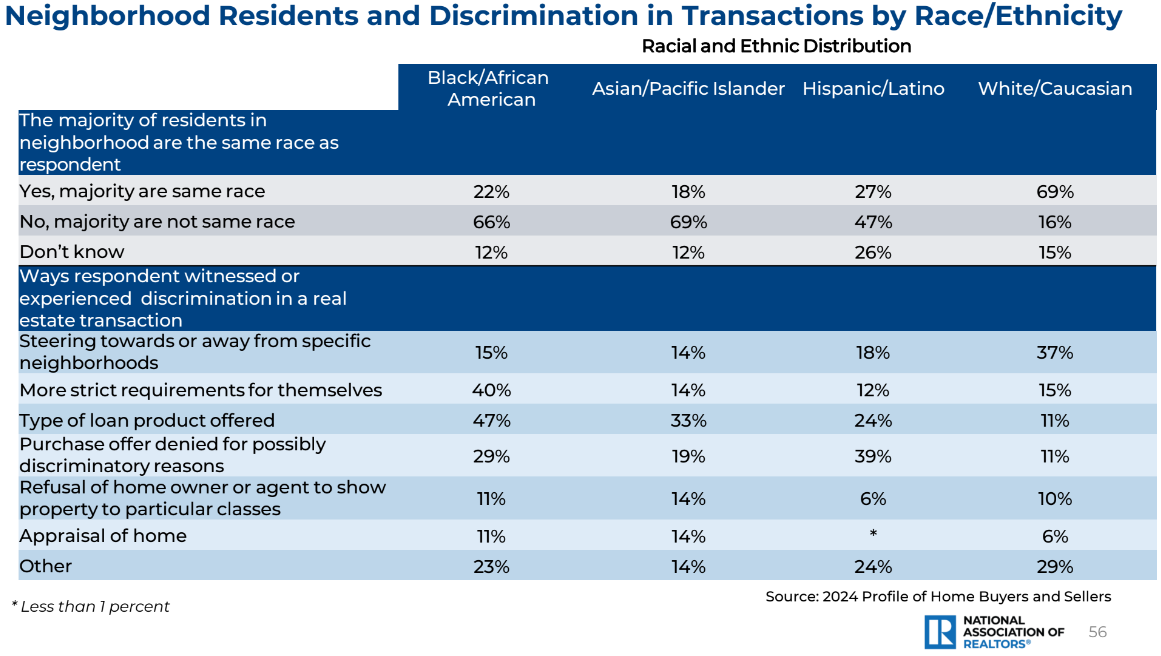
While Black Americans lag other racial groups in terms of homeownership rate, they are also much more likely to report having experienced or witnessed discrimination in real estate transactions, particularly when it comes to obtaining a mortgage.
According to NAR’s 2024 Profile of Home Buyers and Sellers, 47% of Black respondents reported discrimination in the type of loan they were offered, compared to 33% of Asian respondents, 24% of Hispanic respondents and 11% of white respondents. Black respondents were also more likely to report experiencing stricter requirements, compared to just 12% to 15% for the other races.
Title VIII of the Civil Rights Act of 1968, also known as the Fair Housing Act, makes it illegal to discriminate on race during the homebuying process.
Courtesy of the National Association of REALTORS®.