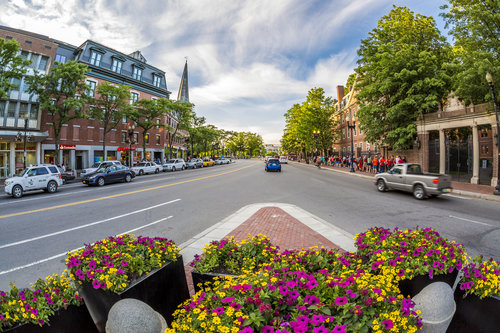
Cambridge was Greater Boston’s top luxury housing market in the second quarter, according to new research from Redfin.
Within Cambridge’s luxury market, the average sales price was $3.703 million in Q2, a 53.8 percent increase over Q2 2015; that dwarfed the rest of the market, where sales prices rose 19.0 percent to $578,000.
There were other Greater Boston markets where luxury prices rose aggressively – in Brockton and Salem, for instance, luxury prices were up 19.5 and 17.5 percent, respectively – but in many other markets, luxury housing performed worse than the rest of the market.
Notable examples include:
- Attleboro, where luxury prices fell 50.5 percent (compared to a 8.6 percent gain for the rest of the market)
- Beverly, where luxury prices fell 20.4 percent (compared to a 13.6 percent gain)
- Lynn, where luxury prices fell 3.8 percent (compared to a 4.9 percent gain)
- Newton, where luxury prices fell -7.5 percent (compared to a -3.6 percent drop)
- And Waltham, where luxury prices fell 3.9 percent (compared to a 12.4 percent gain)
See our charts below for more information on both Greater Boston’s top luxury markets and all the markets we have data for:
Top 10 Luxury Markets
| City | Avg Luxury Sales Price | YOY Change | Avg Sale Price – Rest of Market | YOY Change |
|---|---|---|---|---|
| Cambridge | $3,703,000 | 53.8% | $889,000 | 19.0% |
| Brockton | $442,000 | 19.5% | $228,000 | 13.4% |
| Salem | $678,000 | 17.5% | $320,000 | 7.7% |
| Malden | $638,000 | 16.8% | $339,000 | 11.1% |
| Boston | $3,556,000 | 15.7% | $649,000 | 7.3% |
| Medford | $876,000 | 5.7% | $479,000 | 8.9% |
| Braintree Town | $787,000 | 3.4% | $417,000 | 8.6% |
| Haverhill | $498,000 | 2.5% | $256,000 | 11.8% |
| Lowell | $399,000 | 0.8% | $210,000 | 2.9% |
| Newburyport | $1,133,000 | 0.0% | $502,000 | 7.7% |
All Greater Boston Markets
| City | Avg Luxury Sales Price | YOY Change | Avg Sale Price – Rest of Market | YOY Change |
|---|---|---|---|---|
| Attleboro | $509,000 | -50.5% | $279,000 | 8.6% |
| Beverly | $1,364,000 | -20.4% | $410,000 | 13.6% |
| Boston | $3,556,000 | 15.7% | $649,000 | 7.3% |
| Braintree Town | $787,000 | 3.4% | $417,000 | 8.6% |
| Brockton | $442,000 | 19.5% | $228,000 | 13.4% |
| Cambridge | $3,703,000 | 53.8% | $889,000 | 19.0% |
| Haverhill | $498,000 | 2.5% | $256,000 | 11.8% |
| Lowell | $399,000 | 0.8% | $210,000 | 2.9% |
| Lynn | $431,000 | -3.8% | $257,000 | 4.9% |
| Malden | $638,000 | 16.8% | $339,000 | 11.1% |
| Marlborough | $587,000 | -2.5% | $315,000 | 1.9% |
| Medford | $876,000 | 5.7% | $479,000 | 8.9% |
| Newburyport | $1,133,000 | 0.0% | $502,000 | 7.7% |
| Newton | $3,043,000 | -7.5% | $988,000 | -3.6% |
| Peabody | $599,000 | -5.1% | $346,000 | 3.9% |
| Quincy | $797,000 | -0.1% | $372,000 | 3.9% |
| Salem | $678,000 | 17.5% | $320,000 | 7.7% |
| Somerville | $1,384,000 | -5.1% | $646,000 | 4.9% |
| Taunton | $461,000 | -0.2% | $238,000 | 1.3% |
| Waltham | $893,000 | -3.9% | $498,000 | 12.4% |
| Weymouth Town | $584,000 | -1.2% | $315,000 | 4.3% |
| Woburn | $758,000 | -2.9% | $403,000 | -2.4% |
| Worcester | $390,000 | -5.1% | $193,000 | 6.6% |

