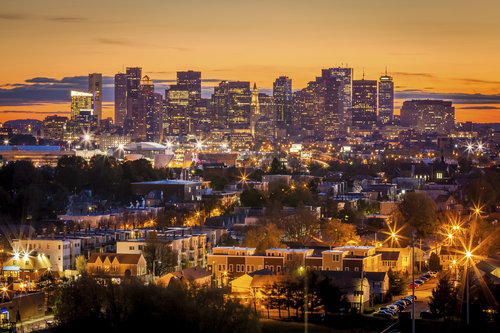
The Boston luxury housing market is among the top-performing in the nation, according to a new analysis from Redfin.
In 2016’s second quarter, the average sales price for luxury housing in Boston was $3.556 million, a 15.7 percent increase over last year that is not only double the 7.3 percent increase for the rest of the area’s housing, but also far above the 0.8 percent increase for the nation’s luxury markets.
Click on the tabs below to adjust between the nation’s top-performing (and top-slowing) luxury markets.
| City | Average Sale Price – Luxury | YOY Change | Average Sale Price – Rest of Market | YOY Change |
|---|---|---|---|---|
| Stuart, FL | $2,935,000 | 139.4% | $279,000 | 26.2% |
| Longmont, CO | $1,358,000 | 28.7% | $387,000 | 18.0% |
| Henderson, NV | $1,149,000 | 28.4% | $262,000 | 5.2% |
| Murrieta, CA | $1,017,000 | 24.2% | $377,000 | 9.9% |
| Miami Beach | $8,851,000 | 21.6% | $683,000 | 16.8% |
| Asheville, NC | $1,000,000 | 17.1% | $281,000 | 10.2% |
| Alpharetta | $1,281,000 | 15.8% | $379,000 | 5.9% |
| Boston | $3,556,000 | 15.7% | $649,000 | 7.3% |
| Portland, OR | $1,216,000 | 15.2% | $412,000 | 13.2% |
| Boca Raton | $3,024,000 | 13.4% | $335,000 | 1.8% |
| San Diego | $2,511,000 | 13.2% | $568,000 | 6.4% |
| Bend, OR | $1,142,000 | 11.9% | $402,000 | 12.3% |
| Highlands Ranch, CO | $1,039,000 | 11.7% | $437,000 | 7.1% |
| Clearwater, FL | $1,062,000 | 11.1% | $191,000 | 13.0% |
| Tampa | $1,130,000 | 10.9% | $222,000 | 12.7% |
| City | Average Sale Price – Luxury | YOY Change | Average Sale Price – Rest of Market | YOY Change |
|---|---|---|---|---|
| The Woodlands | $1,639,000 | -23.4% | $380,000 | -11.6% |
| Palm Desert, CA | $1,626,000 | -22.9% | $337,000 | 4.3% |
| Hollywood, FL | $1,255,000 | -14.3% | $247,000 | 6.5% |
| Long Beach, CA | $1,386,000 | -13.6% | $485,000 | 6.4% |
| Oceanide, CA | $1,021,000 | -13.1% | $439,000 | 4.0% |
| San Francisco | $5,133,000 | -11.1% | $1,285,000 | 0.9% |
| Scottsdale, AZ | $2,008,000 | -10.4% | $437,000 | 3.3% |
| Alexandria | $1,215,000 | -5.7% | $470,000 | 1.1% |
| Fort Lauderdale | $2,123,000 | -4.9% | $336,000 | 1.5% |
| Bellevue, WA | $3,017,000 | -4.2% | $791,000 | 12.2% |
| Washington, D.C. | $2,294,000 | -4.1% | $589,000 | 3.5% |
| West Palm Beach | $1,216,000 | -3.8% | $190,000 | 2.7% |
| Temecula, CA | $1,182,000 | -3.8% | $427,000 | 5.4% |
| Sarasota, FL | $1,638,000 | -3.4% | $276,000 | 4.9% |
| John Creek, GA | $1,110,000 | -2.0% | $391,000 | 5.7% |
Photo Credit: Thomson200, Creative Commons CC0 1.0 Universal Public Domain Dedication, https://commons.wikimedia.org/wiki/File:Alpharetta,_Georgia_City_Hall.jpg

