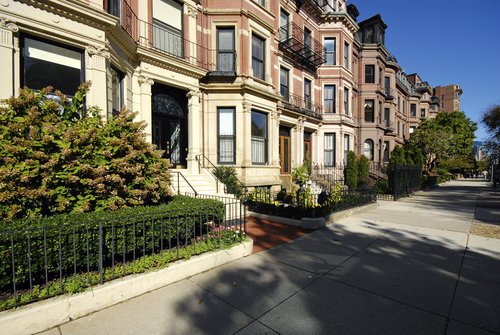
Courtesy of the latest numbers from the Greater Boston Association of Realtors, our chart below details the top 10 condo markets in Boston in May, along with their median sales price and year-over-year changes.
| Area | May Condo Sales | Sales Increase from 2015 | Median Sales Price | Price Increase from 2015 |
|---|---|---|---|---|
| Cambridge | 59 | 0% | $695,000 | 15.8% |
| South End/Bay Village | 57 | 18.8% | $880,000 | -0.6% |
| Brookline | 54 | 5.9% | $825,000 | 16.5% |
| Somerville | 50 | 22% | $599,000 | 3.3% |
| South Boston | 43 | -4.4% | $685,000 | 5.5% |
| Back Bay | 39 | -20.4% | $1,250,000 | 28.9% |
| Jamaica Plain | 35 | -10.3% | $570,000 | 11.8% |
| Newton | 32 | 3.2% | $749,500 | 31% |
| Arlington | 29 | 45% | $449,900 | -8.6% |
| Hyde Park/Roslindale | 26 | 8.3% | $384,500 | 3.8% |
| Allston/Brighton | 26 | -16.1% | $380,000 | -3.8% |

