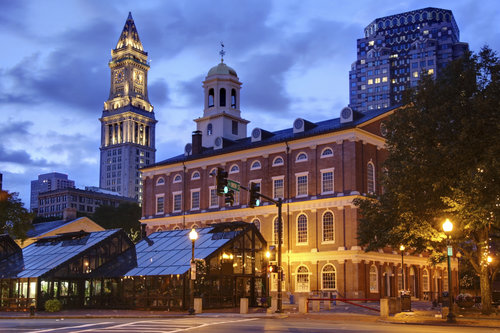
Luxury homes are most prominent in Boston’s Haymarket neighborhood.
That was the finding of a new report from Trulia, which analyzed the market share of million-dollar homes in the nation’s housing markets. In Haymarket, a remarkable 87.5 percent of homes are valued at $1 million or more, up from a 37.5 percent share in 2012.
That 50 percentage point change was also the largest among Boston’s neighborhoods. Other markets with large jumps included Mission Hill (up 32.9 percent), Downtown Crossing (up 23.9 percent) and Chinatown (up 23.6 percent).
Click on the tabs below to adjust between the top luxury markets and the fastest growing luxury markets:
| Boston Neighborhood | Million-Dollar Home Market Share – 2016 | Million-Dollar Home Market Share – 2012 | Percentage Point Change Over Time |
|---|---|---|---|
| Haymarket | 87.5% | 37.5% | 50% |
| West Cambridge | 59.0% | 39.4% | 19.6% |
| Aggasiz/Harvard North | 51.4% | 34.4% | 17.1% |
| Bay Village | 47.1% | 28.8% | 18.3% |
| Downtown | 46.7% | 26.9% | 19.9% |
| Chinatown | 46.3% | 22.6% | 23.6% |
| Back Bay | 43.1% | 29.4% | 13.7% |
| Mission Hill | 38.9% | 6.0% | 32.9% |
| Beacon Hill | 35.0% | 27.2% | 7.8% |
| Downtown Crossing | 34.7% | 10.9% | 23.8% |
| Boston Neighborhood | Share of Million-Dollar Homes, 2012 | Share of Million-Dollar Homes, 2016 | Percentage Point Change Over Time |
|---|---|---|---|
| Haymarket | 37.5% | 87.5% | 50.0% |
| Mission Hill | 6.0% | 38.9% | 32.9% |
| Downtown Crossing | 10.9% | 34.7% | 23.8% |
| Chinatown | 22.6% | 46.3% | 23.6% |
| Cambridgeport | 8.8% | 31.3% | 22.5% |
| Downtown | 26.9% | 46.7% | 19.9% |
| West Cambridge | 39.4% | 59.0% | 19.6% |
| Bay Village | 28.8% | 47.1% | 18.3% |
| Strawberry Hill | 1.9% | 19.2% | 17.3% |
| Aggasiz/Harvard North | 34.4% | 51.4% | 17.1% |

