Only one housing market has seen greater new construction growth in 2015 than Boston
Boston has 2015’s No. 2 new construction marketplace, according to new research from Trulia.
Trulia’s analysis, which compared permit activity in the nation’s metro areas to their historic norms, found that Boston’s building permits in 2015 are 94 percent above those averages; only New York City, where permits are up an incredible 255 percent above norms, has seen stronger activity.
The table below shows how Boston compares with the other top construction markets, and also includes some additional research from Trulia’s report:
| City | 2015 Permit Activity Above Historic Norms | Multifamily Share of 2015 Permits | Multifamily Permit Activity Above Historic Norms | Single-Family Permit Activity Above Historic Norms |
|---|---|---|---|---|
| 1. New York | 255% | 94% | 423% | -50% |
| 2. Boston | 94% | 84% | 295% | -50% |
| 3. Philadelphia | 75% | 70% | 138% | 5% |
| 4. Los Angeles | 74% | 81% | 161% | -44% |
| 5. Newark | 71% | 78% | 290% | -50% |
| 6. San Francisco | 69% | 89% | 102% | -36% |
| 7. Houston | 56% | 36% | 114% | 60% |
| 8. Seattle | 56% | 74% | 153% | -24% |
| 9. Orange County | 53% | 67% | 136% | -24% |
| 10. Dallas | 47% | 45% | 103% | 30% |
In past reports on Boston’s surging new construction marketplace, we have noted that multifamily construction has largely led the charge in Beantown’s market, and Trulia’s numbers reiterate that fact. With 84 percent of all permit activity intended for multifamily projects – and multifamily permits a whopping 295 percent above historic norms – Boston is clearly on a multifamily path right now.
Also, with single-family permits 50 percent below those historic norms, it’s no surprise that Boston’s single-family market remains mired in an affordability crisis.
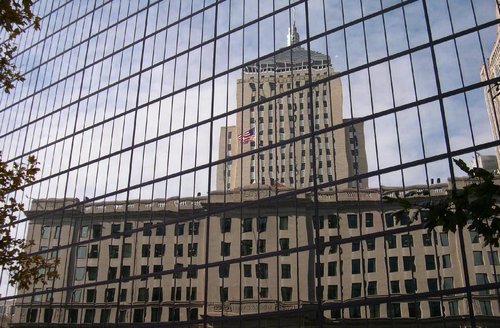
Photo credit: Creative Commons 3.0, Sfoskett: http://upload.wikimedia.org/wikipedia/commons/c/cc/Three_John_Hancock_Buildings.jpg

