Boston is one of the most public transportation-friendly cities in the country, but the distinction might be contributing to the city’s skyrocketing home prices, according to a recent Redfin study.
It’s no secret that homebuyers want homes with easy access to transportation and low commute times to their jobs. As it turns out, sellers of homes that fit the criteria are charging a premium, and buyers seem willing to pay it, according to Redfin.
The study attempts to show how transit access translates to home cost. Their findings show that an increase in one point of a Boston home’s “transit score” adds $3,585 to a home’s cost, the second largest increase of any city. With a median sale price in Boston of $325,000, an increase of one point on a home’s transit score equates to a 1.1 percent increase in the home’s price, according to Redfin.
“Transit is an important building block to economic mobility,” said Redfin chief economist Nela Richardson. “The more that cities invest in good transit the bigger financial impact for homeowners and the better access families of all incomes have to jobs and public amenities. Transit is an economic win-win for communities.”
| Metro Area | Transit Score | Median Sale Price | $ Premium of 1 Transit Score Point On Median Home Price | % Premium of 1 Transit Score Point on Median Home Price |
|---|---|---|---|---|
| Atlanta | 44 | $168,000 | $1,901 | 1.13 |
| Baltimore | 58 | $229,900 | $226 | 0.1 |
| Boston | 74 | $325,000 | $3,585 | 1.1 |
| Chicago | 65 | $220,000 | $1,731 | 0.79 |
| Denver | 47 | $285,000 | $1,366 | 0.79 |
| Los Angeles | 51 | $475,000 | $3,095 | 0.65 |
| Oakland | 55 | $523,000 | $2,816 | 0.54 |
| Orange County | 27 | $580,000 | ($201) | -0.03 |
| Phoenix | 32 | $204,900 | $291 | 0.14 |
| Portland | 51 | $275,000 | $1,338 | 0.49 |
| San Diego | 37 | $449,000 | $786 | 0.18 |
| San Francisco | 80 | $950,000 | $4,845 | 0.51 |
| Seattle | 57 | $375,000 | $3,360 | 0.9 |
| Washington D.C. | 71 | $360,000 | $3,457 | 0.96 |
A 2016 Redfin study of the best cities for public transit puts Boston at third, behind New York City and San Francisco. There appears to be correlation between how good a city’s public transit system is and how much the system boosts home prices.
Of the 14 cities included in Redfin’s study, San Francisco and Boston had the best transit scores, with San Francisco at 80 and Boston at 74. San Francisco had the highest average price increase per 1-point increase in transit score, with $4,845 being tacked on for every transit score point. The city with the third highest transit score – Washington D.C. – also had the third highest average home increase, at $3,457. (Boston is second in both transit score and average home price increase per transit score increase. New York City was not included in the study.)
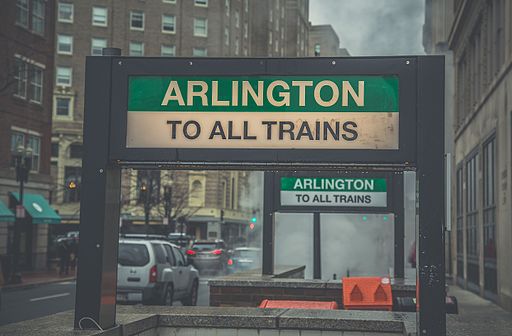
Because real estate is driven by location, which transit stop a home has access to is also a big factor in a home’s price. A 2016 analysis by Estately shows that homes along the Green Line are some of the most expensive in the city, with the Arlington stop in Black Bay commanding the highest median sales price of $1.17 million.
Photo by Tony Webster from San Francisco, California (TO ALL TRAINS) [CC BY 2.0], via Wikimedia Commons


JORDAN LEWIS RING
WHAT IS MAKING HOMES MORE EXPENSIVE IS THE MASSIVE POLITICAL FRAUD TIED TO PENSON FUNDS UNFUNDED AND THE RAGING INCOMPETENCE OF ELECTED IDIOTS THAT FILL MASS POLITICAL POSITIONS WITH THE BIGGEST PILE OF PIG DUNG IN THE HISTORY OF THE PLANET…IN X……CRASH!