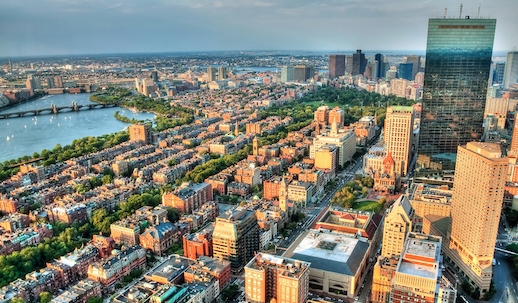
Boston has one of the most unequal housing markets in the country.
In an analysis of the country’s biggest housing markets, Redfin compared avg. luxury home price with the bottom 95 percent of the market, respectively. Of the 10 most unequal cities nationwide, as the below graph shows, Boston is the only New England city.
And how unequal is it? About 5.7 times as much, according to Redfin.

The report’s grimmest finding is that Boston’s housing inequality is growing. In last year’s final quarter, as the below table shows, the city’s average luxury home price jumped 16.8 percent year over year to $3.8 million, the sixth highest increase nationwide and a good indicator for how luxury prices will move in 2017.
| Cities with Largest Luxury Price Increases | Avg. Sale Price (Top 5% percent) | YoY Change | Avg. Sale Price (Bottom 95%) | YoY Change |
| Santa Clarita, Calif. | $2,025,000 | 113.80% | $460,000 | 6.50% |
| West Palm Beach | $1,173,000 | 29.00% | $193,000 | 10.90% |
| Tampa | $1,144,000 | 27.10% | $227,000 | 15.80% |
| San Francisco | $5,816,000 | 24.40% | $1,260,000 | 3.60% |
| Portland | $1,246,000 | 19.60% | $408,000 | 11.80% |
| Boston | $3,846,000 | 16.80% | $642,000 | 6.50% |
| Los Angeles | $4,870,000 | 15.00% | $716,000 | 7.50% |
| St. Petersburg, Fla. | $1,068,000 | 10.10% | $199,000 | 17.10% |
| Oakland | $2,058,000 | 8.90% | $684,000 | 8.40% |
| Littleton, Col. | $1,052,000 | 8.60% | $390,000 | 9.60% |
Right now, Boston’s price increases are being catalyzed by its crippling inventory shortage. Both the city’s single-family and condo inventories are just barely more than a 1-month supply, and shrinking. With little available, home buyers are being forced to compete over properties, unnaturally inflating home values.