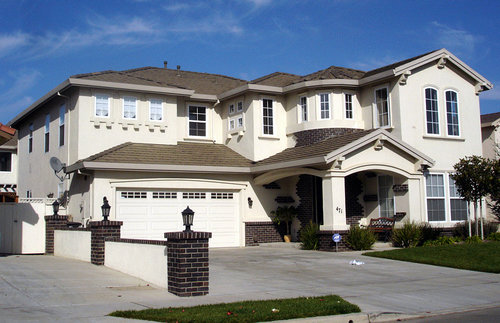
McMansions – the mass-produced, over-the-top, poorly appreciating eyesores that became the poster children of the housing bubble – seemed to be on the way out. Average and median home size had fallen considerably during the market downturn, as builders trimmed their ambitions and consumers lowered their expectations.
Reports of the McMansion’s death, though, proved to be greatly exaggerated. Starting in 2013 and culminating in the start of this year, new home size resumed its steady increase, with square footage topping even the lofty levels of the bubble years.
But now, two reports have offered interesting wrinkles in the McMansion narrative, which may – just may – be coming to a close.
New home size on the decline?
The first report, courtesy of a new analysis from the National Association of Home Builders, revealed that after several years of growth, the size of newly built single-family home declined in 2016’s second quarter.
With a median square footage of 2,392 and an average of 2,616, new home size is down 3.05 and 1.58 percent from the first quarter, and 3.43 and 3.25 percent from a year ago, respectively.
Single-family home size, the NAHB explained, typically follows a pattern – during periods of growth, home sizes rise, and then during recessions, homebuyers and builders alike tighten their budgets, and sizes decline. The most recent housing recovery, though, has been unique with its relative lack of first-time buyers, and as a result, homebuilders have tailored their products to wealthier consumers (which has only made home sizes larger).
The McMansion price premium
Could the second quarter’s decline, though, mean that such a trend is ending? That could certainly be inferred from new Trulia research, which found that from 2012 to 2016, the price premium for McMansions has declined from 138 percent of a typical home to 117 percent.
That trend, one of McMansions losing their value, has been even more pronounced here in Greater Boston. In 2012, Greater Boston McMansions were worth $694,730 to the area’s median price of $318,296, which was a 118.3 percent premium; now, they are worth $775,482 to $400,948, a 93.4 percent premium (a point change of 24.9 percent).
The McMansion price premium is not consistent across all metro areas – our chart below shows that it has fallen only 6.3 percent in New York, and only 7.8 percent in Philadelphia – but in numerous markets, super-sized homes do not seem to be the draw they used to be.
| 2012 McMansion Premium | 2016 McMansion Premium | Point Change in Premium | |
|---|---|---|---|
| Atlanta | 136.3% | 112.8% | -23.6% |
| Boston | 118.3% | 93.4% | -24.9% |
| Chicago | 145.5% | 118.9% | -26.6% |
| Dallas | 126.2% | 104.3% | -21.9% |
| Denver | 133.5% | 94.1% | -39.4% |
| Houston | 138.5% | 107.2% | -31.3% |
| Los Angeles | 96.3% | 71.0% | -25.3% |
| Miami | 280.3% | 197.6% | -82.7% |
| New York | 79.6% | 73.2% | -6.3% |
| Philadelphia | 316.1% | 308.2% | -7.8% |
| Phoenix | 137.3% | 95.3% | -42.0% |
| San Francisco | 204.1% | 165.9% | -38.2% |
| Seattle | 101.8% | 82.7% | -19.1% |
Photo Credit: Creative Commons Attribution-Share Alike 2.5 Generic, Brendel, https://commons.wikimedia.org/wiki/File:Large_Salinas_house.jpg

